-
CVD Graphene Liquid-Cell TEM of Polymers - IBS UNIST, 2017
May 20, 2026 | ACS MATERIAL LLCNagamanasa, K. H., Wang, H., & Granick, S. (2017). Liquid-Cell Electron Microscopy of Adsorbed Polymers. *Advanced Materials*. https://doi.org/10.1002/adma.201703555
IBS Center for Soft and Living Matter UNIST Ulsan 689‐798 South Korea · Advanced Materials · 2017
IBS Center for Soft and Living Matter UNIST used ACS Material CVD graphene to build liquid pockets and image individual PSS and PEO polymer molecules by TEM.
About this research
Researchers at IBS Center for Soft and Living Matter UNIST Ulsan 689‐798 South Korea demonstrated, using commercial CVD graphene from ACS Material, that individual synthetic polymer molecules can be imaged in aqueous solution with nanometer resolution by transmission electron microscopy. By trapping aqueous polymer solutions inside creased graphene liquid pockets, the team visualized single chains of polystyrene sulfonate (PSS) and poly(ethylene oxide) (PEO) at 0.3 s per frame for up to 100 s on an ordinary TEM, without any metal-ion labeling. The work, published in Advanced Materials in 2017 by Nagamanasa, Wang, and Granick, opens a route to studying polymer adsorption, conformational dynamics, and adsorption–desorption kinetics that was previously the exclusive territory of optical single-molecule methods.
Direct electron-microscopy observation of individual organic macromolecules in liquid water is hard for two reasons. Organic chains scatter electrons weakly because of their low atomic number, and both the polymer and the surrounding water are easily damaged by the electron beam. Conventional workarounds rely on heavy-metal staining or sealing the liquid behind thick silicon nitride windows, which limits contrast and the questions one can ask about native polymer conformation. The field of polymer physics has long sought a real-space tool for watching how polyelectrolytes such as PSS or neutral chains such as PEO adsorb, fluctuate, and exchange on surfaces under realistic ionic conditions. Liquid-cell TEM with atomically thin graphene windows directly addresses this gap, with potential impact for polymer adsorption theory, coatings, separation membranes, and the rational design of polymer-based biomedical interfaces.In Liquid Cell Transmission Electron Microscopy (LCTEM), your imaging resolution is entirely bottlenecked by the thickness of your viewing window. Traditional silicon nitride membranes scatter the electron beam, obscuring critical dynamic interactions of polymers, nanoparticles, and biological samples. As demonstrated by IBS and UNIST, ACS Material's CVD Graphene provides an atomically thin, ultra-strong, and electron-transparent barrier—virtually eliminating beam scattering and enabling true sub-nanometer resolution in liquid states. Explore our pristine CVD Graphene on Copper / TEM Grids to upgrade your in-situ microscopy capabilities and capture liquid dynamics at the atomic scale.
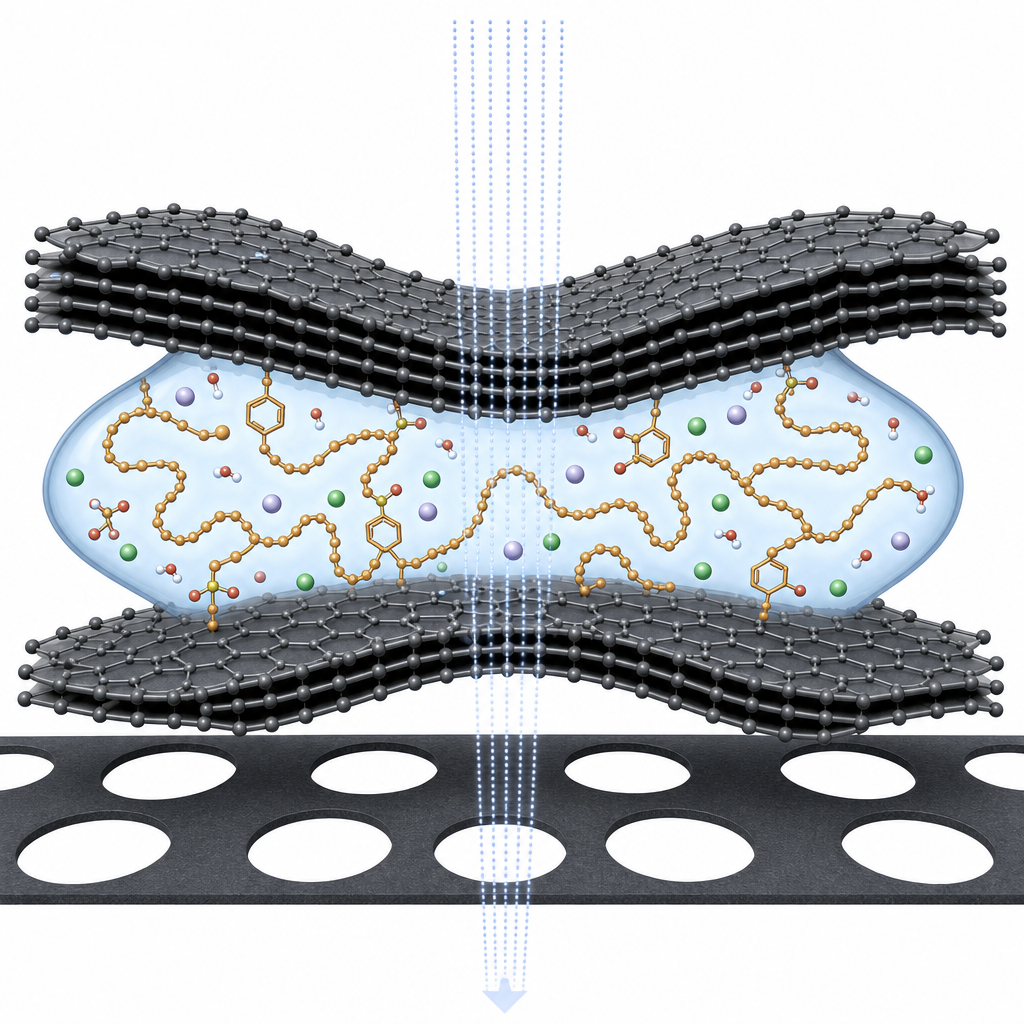
The central enabling component was ACS Material CVD graphene. The authors state explicitly: "using commercial graphene (ACS Materials), we use 2-layer graphene for the bottom and 3–5-layer graphene for the top, as this combination gives the required stability as well as contrast." CVD graphene on copper foil was transferred onto a holey-carbon gold TEM grid (Quantifoil) to form the bottom window, then a roughly 0.5 µL droplet of 1 wt% aqueous polymer solution (PSS or PEO, with or without 0.2 M NaCl) was deposited. A thicker 3–5-layer graphene sheet was laid on top so that mechanical creases trapped the liquid into discrete pockets. The graphene served simultaneously as an electron-transparent window, a mechanical containment for the aqueous solution, and a heat- and charge-spreading layer that mitigates radiation damage. Its impermeability to small molecules kept the liquid pockets stable for the full imaging window.
The authors imaged PSS of two molecular weights and PEO, in deionized water and in 0.2 M NaCl, with 0.3 s exposure per frame and 1 s spacing. Discrete polymer molecules were clearly resolved, with a measured "pixel span" Ps of about 20 nm, somewhat smaller than the free-solution radius of gyration (Rg ≈ 30–50 nm) because only sluggish adsorbed segments contribute to contrast. Statistical analysis covered roughly 35–40 molecules per condition and five frames per molecule, with 119–190 events per distribution. As expected from polymer physics, the peak of the Ps distribution shifted to smaller values when molecular weight was reduced and when 0.2 M NaCl was added, confirming that genuine single-chain configurations were being observed. Conformational fluctuations and adsorbed-segment count fluctuations (Pc) had standard deviations of 9% and 10%, respectively, over 70 s of continuous imaging. The team also documented reversible desorption–readsorption "jump" events and a coil-to-stretch transition for individual chains. The estimated cumulative electron dose of ~200 C m⁻² is comparable to literature thresholds for bulk PSS and PEO, indicating that the graphene environment effectively retards beam damage and that observed dynamics are not artifacts of irradiation. Chain scission and recombination events were occasionally seen only after long exposures (~45–125 s).
This liquid-cell graphene TEM platform is broadly relevant to soft-matter, colloid, and polymer-science research. It enables direct visualization of polyelectrolyte adsorption under tunable ionic strength, characterization of conformational heterogeneity in polydisperse samples, and tracking of single-molecule dynamics at interfaces — all on a standard TEM that most electron-microscopy facilities already operate. Adjacent applications include imaging block-copolymer self-assembly in solution, surfactant and protein adsorption on 2D materials, drug-carrier polymer dynamics, and in situ monitoring of polymer brushes or membrane fouling. Because the technique requires no heavy-metal staining, it preserves native chemistry and is compatible with biologically realistic aqueous conditions.
For researchers working on similar problems, the relevant product — CVD graphene grown on copper foil — is part of ACS Material's CVD Graphene catalog and is offered with various layer counts suited to building graphene liquid cells, TEM support windows, and 2D heterostructure stacks. The paper underscores that consistent layer thickness and clean transfer are key to obtaining stable liquid pockets and translucent contrast, and that commercially sourced CVD graphene meets these requirements for demanding in situ TEM workflows.How ACS Material products were used
- CVD Graphene on Copper Foil (CVD Graphene) — “Specifically, using commercial graphene (ACS Materials), we use 2-layer graphene for the bottom and 3–5-layer graphene for the top... First, we transfer CVD-grown graphene from copper foil onto a holey carbon gold TEM grid”
Product Performance in this StudyThe ACS Material CVD graphene served as the atomically thin window material for the liquid-cell TEM pockets. The combination of 2-layer (bottom) and 3-5-layer (top) graphene delivered the mechanical stability and contrast required to image individual polymer molecules in water at nanometer resolution, while also retarding electron-beam damage.
Related product categories
Frequently asked questionsWhy is CVD graphene used as a liquid-cell TEM window for imaging polymers?
CVD graphene is atomically thin, so it scatters very few electrons and provides high contrast for low-atomic-number polymer chains. It is impermeable to small-molecule liquids, allowing stable aqueous pockets, and its high thermal and electrical conductivity helps dissipate heat and charge from the electron beam, retarding radiation damage. These properties together let researchers image individual PSS and PEO molecules in water without heavy-metal staining.
How many graphene layers are needed to build a stable liquid pocket for TEM?
In this study the authors used 2-layer CVD graphene as the bottom window, supported by a holey-carbon gold TEM grid, and 3–5-layer graphene as the top sheet. This asymmetric stack provided enough mechanical integrity to seal aqueous 1 wt% polymer solutions into creased pockets while remaining thin enough to keep electron contrast high. Thicker top layers help trap the liquid; thinner bottom layers preserve image quality.
What polymer dynamics can be observed with graphene liquid-cell TEM?
The technique resolves single adsorbed polymer chains with about 20 nm pixel span at 0.3 s per frame. Over 70–100 s researchers can track conformational fluctuations, changes in the number of adsorbed segments, reversible adsorption–desorption "jump" events, and coil-to-stretch transitions. Statistical analysis of size distributions also captures the effect of molecular weight and salt concentration on adsorbed-chain dimensions.