-
Carboxyl Graphene Oxide Nanoscale TERS Imaging - Hangzhou Dianzi University, 2018
May 22, 2026 | ACS MATERIAL LLCSu, W., Kumar, N., Krayev, A., & Chaigneau, M. (2018). In situ topographical chemical and electrical imaging of carboxyl graphene oxide at the nanoscale. *Nature Communications*. https://doi.org/10.1038/s41467-018-05307-0
Nature Communications · 2018
Researchers at Hangzhou Dianzi University used tip-enhanced Raman spectroscopy to map functional groups on carboxyl graphene oxide with ~10 nm spatial resolution.
About this research
Researchers led by Hangzhou Dianzi University, working with the UK National Physical Laboratory, Utrecht University, and HORIBA, used carboxyl-functionalized graphene oxide (GO–COOH) to demonstrate simultaneous topographical, chemical, and electrical imaging at the nanoscale via tip-enhanced Raman spectroscopy (TERS). The team achieved a spatial resolution of approximately 10 nm and, critically, correlated local defect density (the Raman ID/IG ratio) with the local Fermi level on the GO–COOH surface. This multi-parameter, in situ approach removes ambiguities that arise when topography, chemistry, and electronic properties are measured separately, and it sets a benchmark for characterizing 2D-material-based optoelectronic devices under realistic operating conditions.
Graphene oxide and its chemically modified derivatives such as GO–COOH are key building blocks for sensors, membranes, supercapacitor electrodes, drug-delivery carriers, and printed flexible electronics. Their performance depends sensitively on the spatial distribution of oxygen-containing functional groups (epoxy, hydroxyl, carbonyl, carboxyl) and on lattice defects, both of which vary across a single flake. Conventional Raman, XPS, and AFM provide only averaged or topographical information, leaving the connection between local chemistry and local electronic structure poorly resolved. Mapping individual functional groups at the 10 nm scale—and tying that map to electronic properties such as the Fermi level—directly addresses an open challenge in 2D-materials research: how heterogeneity in chemical functionalization controls device behavior in graphene-oxide-based transistors, biosensors, and energy-storage electrodes.
The GO–COOH was prepared by a two-step functionalization route that converts a fraction of the C–O and C–O–C groups of pristine graphene oxide into COOH, yielding flakes with thick-layer and few-layer regions deposited on a conductive substrate. These flakes were the central specimen for the side-illumination AFM-TERS setup, which combined an Au-coated AFM probe, 638 nm excitation laser, and an electrically biased tip enabling Kelvin probe-style surface potential measurement. TERS spectra were acquired across 100 × 100 pixel grids at 0.4 s per pixel, with nominal 10 nm pixel size. Eight Raman bands were assigned to specific functionalities, including 1097 cm⁻¹ (C–O), 1179 cm⁻¹ (C–O–C), 1330 cm⁻¹ (C–CH₃), 1350 cm⁻¹ (D band), 1420 cm⁻¹ (C–H), 1590 cm⁻¹ (G band), 1654 cm⁻¹ (C=O), and 1747 cm⁻¹ (COOH). The carboxyl-functionalized graphene oxide thus served as a chemically rich, well-characterized test platform for validating the multi-parameter nanoscope.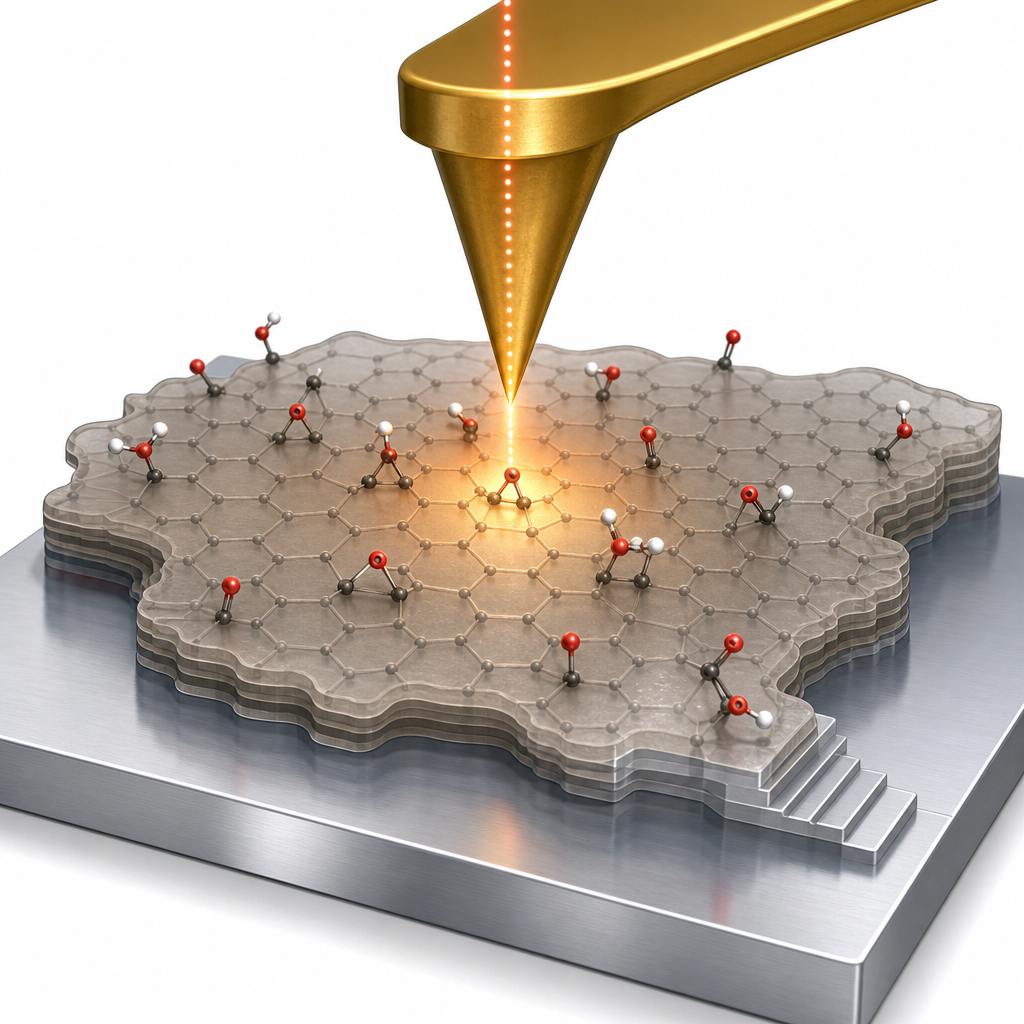
The TERS maps revealed that different functional groups have distinct spatial distributions on the GO–COOH surface. C–O, C–O–C, C=O and COOH groups occupied only 1.3%, 1.0%, 0.5% and 0.6% of the imaged area respectively, appearing as localized clusters rather than the uniform decoration predicted by the Lerf–Klinowski model. By contrast, C–CH₃ and C–H groups were more widely distributed, with C–CH₃ groups preferentially enhanced at flake steps and edges—consistent with a preferred orientation of their Raman polarizability tensor along the tip's axial near-field. Fitting Gaussian profiles across sharp features yielded an average spatial resolution of 10.5 ± 1.7 nm. The most striking electronic finding is the inverse correlation between the local ID/IG ratio and the local Fermi level: as defect density rises, the Fermi level at the GO–COOH surface drops. This direct, in situ link between nanoscale chemistry, defect structure, and electronic properties had not previously been demonstrated on a functionalized 2D material.
The ability to image chemistry and electronics simultaneously at ~10 nm resolution has practical implications across fields that exploit graphene oxide derivatives. In flexible and printed electronics, it allows engineers to verify that functionalization is reaching device-critical regions. In electrocatalysis and supercapacitor research, the correlation between defect-driven Fermi level shifts and local functional-group density helps explain capacity and selectivity variations between batches. In biosensing, where COOH groups anchor bioreceptors, the localized rather than uniform COOH distribution observed here changes how surface coverage and binding capacity should be modeled. The authors point to extending the method to operating optoelectronic devices and to other 2D systems such as MoS₂ and h-BN.
For researchers needing well-defined carboxyl-functionalized graphene starting material for similar TERS, AFM, electrochemistry, or composite studies, Carboxyl Graphene (–COOH) is available from ACS Material, along with a broad range of graphene oxide, reduced graphene oxide, and functionalized 2D materials. Selecting a consistent, characterized GO–COOH source is important for reproducing the nanoscale chemical heterogeneity and ID/IG-vs-Fermi-level relationships reported in this study, particularly when scaling from spectroscopy on individual flakes to working devices.How ACS Material products were used
- Carboxyl Graphene (-COOH) (Graphene Series) — “mapping of functional groups on a carboxyl-modified graphene oxide (GO–COOH) surface with a spatial resolution of ≈10 nm using tip-enhanced Raman spectroscopy (TERS)”
Product Performance in this StudyCarboxyl-functionalized graphene oxide served as the central 2D test specimen for nanoscale TERS imaging. Its heterogeneous distribution of functional groups (C–O, C–O–C, C=O, COOH, C–CH3, C–H) and defect-dependent Fermi level were successfully resolved at ~10 nm spatial resolution, validating its suitability for surface-chemistry studies.
Related product categories
Frequently asked questionsHow does tip-enhanced Raman spectroscopy map functional groups on graphene oxide?
Tip-enhanced Raman spectroscopy uses a metallic AFM tip illuminated by a laser to confine the electromagnetic field below 10 nm at the apex. The enhanced field probes Raman-active vibrations of functional groups directly beneath the tip. By raster-scanning the tip and recording a full spectrum at each pixel, distinct bands such as 1097, 1179, 1654, and 1747 cm⁻¹ can be assigned to C–O, C–O–C, C=O, and COOH groups, producing chemically resolved maps.
Why is carboxyl graphene oxide important for 2D materials research?
Carboxyl graphene oxide combines the high surface area and 2D structure of graphene with reactive COOH groups that anchor biomolecules, metal ions, or polymers. This makes it useful in biosensors, drug-delivery carriers, supercapacitor electrodes, membranes, and conductive composites. The local distribution of COOH and other oxygen functionalities directly affects electrical conductivity, Fermi level, and device performance, so well-defined GO–COOH starting material is critical for reproducible research.
What does the ID/IG ratio reveal about graphene oxide surfaces?
The ID/IG ratio is the intensity ratio of the Raman D band near 1350 cm⁻¹ to the G band near 1590 cm⁻¹. A higher ID/IG indicates more lattice defects, vacancies, and disrupted sp² domains. This study used nanoscale TERS to show that as the local ID/IG ratio increases on a GO–COOH surface, the local Fermi level decreases, providing direct experimental evidence that defect density modulates electronic structure at sub-10 nm scales.