
Before a DNA, RNA or protein preparation goes into the next experiment, most labs check it with a quick UV absorbance reading. This guide explains what the A260/A280 and A260/A230 ratios mean, how to turn A260 into a concentration, how to estimate protein at 280 nm, and which habits (a buffer blank, a UV-transparent cell, background correction) keep the numbers trustworthy.
Quick answer: The A260/A280 ratio compares a sample's absorbance at 260 nm, where the bases of nucleic acids absorb most strongly, with its absorbance at 280 nm, where proteins absorb mainly through tryptophan and tyrosine [6][8]. Common rules of thumb are about 1.8 for DNA and about 2.0 for RNA; an appreciably lower value may indicate protein, phenol or another contaminant absorbing at or near 280 nm [1]. A260/A230, commonly 2.0–2.2, is a secondary check for contaminants absorbing near 230 nm [1]. Both are rules of thumb: a ratio can flag contamination, but it cannot prove that a sample is pure [1][2].
1. Why Nucleic Acids Are Read at 260 nm and Proteins at 280 nm
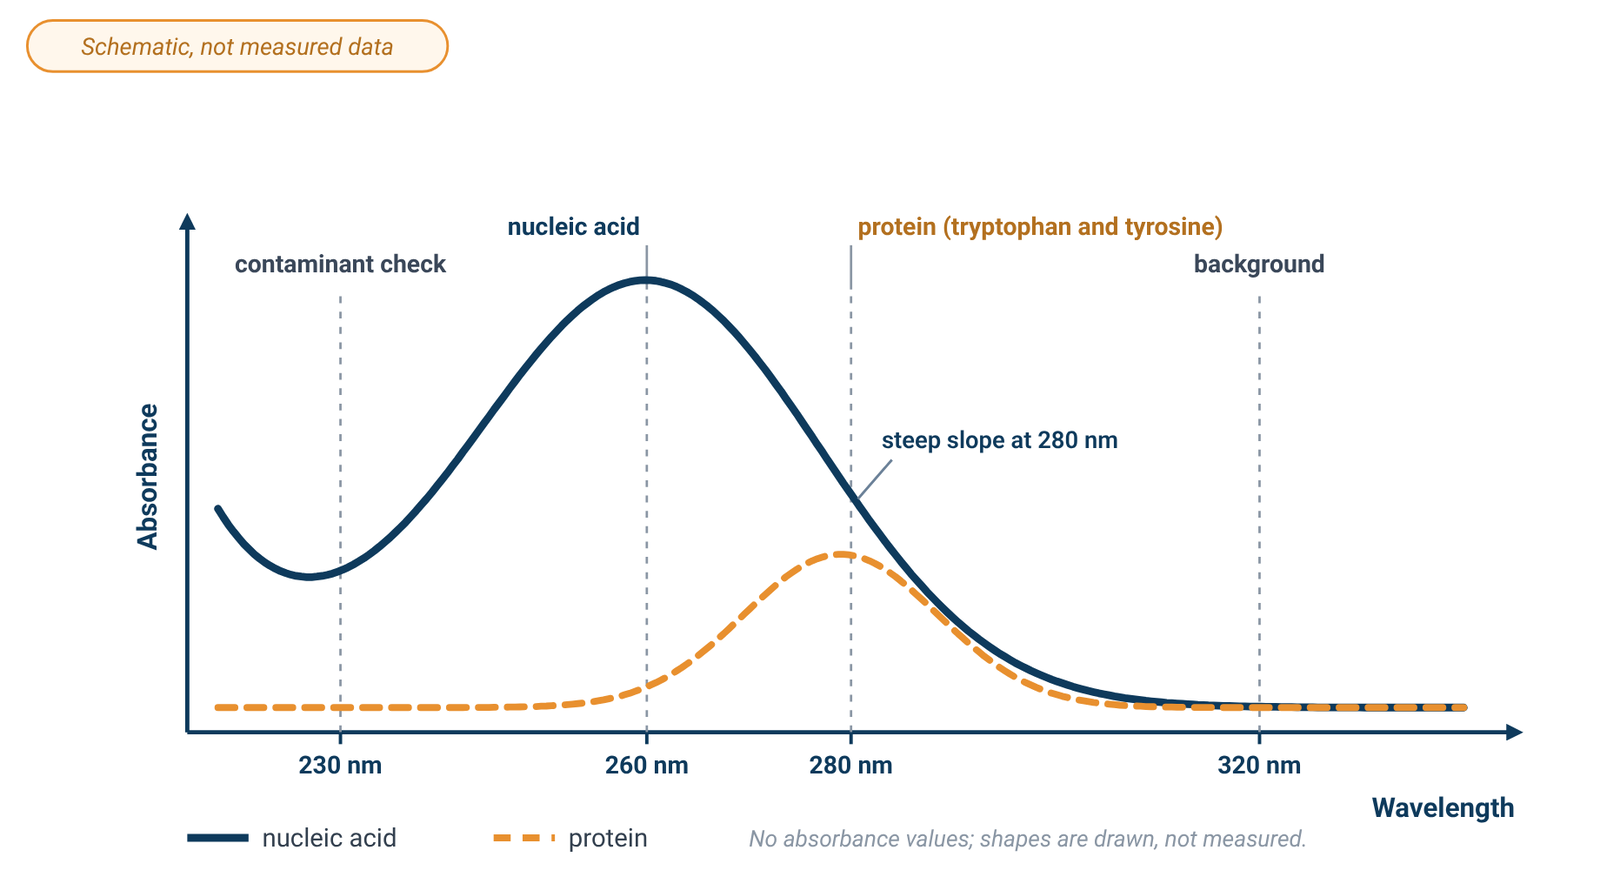
The UV absorbance of DNA comes mainly from its purine and pyrimidine bases, which give a peak maximum at 260 nm [8]. An intact double helix absorbs less than the sum of its bases, because hydrogen bonding between base pairs changes their electronic environment; when DNA is heated and the strands separate, absorbance at 260 nm rises, which is the basis of DNA melting curves [8]. Protein spectra, by contrast, come largely from the aromatic amino acids tryptophan, tyrosine and phenylalanine [8], and a protein's absorbance at 280 nm depends on its content of tryptophan, tyrosine and cystine (disulfide bonds) [6].
Each nucleotide has its own 260/280 ratio: about 1.15 for guanine, 4.50 for adenine, 1.51 for cytosine, 4.00 for uracil and 1.47 for thymine [1]. The ratio of a nucleic acid is roughly the weighted average of its nucleotides, so it depends on composition, and RNA, which contains uracil instead of thymine, typically reads higher than DNA [1].
2. DNA and RNA Concentration from Absorbance at 260 nm
Concentration follows from the Beer–Lambert law, A = εbc, where b is the path length and c the concentration (see our Beer–Lambert law formula guide). For nucleic acids, labs normally use standard conversion factors for a 1 cm path instead of a molar absorptivity [4].
Table 1. Standard A260 conversion factors (1 cm path)
| Nucleic acid | Concentration giving A260 = 1.0 |
|---|---|
| Double-stranded DNA | 50 µg/mL |
| Single-stranded RNA | 40 µg/mL |
| Single-stranded DNA | 33 µg/mL |
Source: Promega technical note [4], citing Sambrook and co-workers; the dsDNA value also in [5].
For a diluted sample, concentration (µg/mL) = A260 × dilution factor × conversion factor [5].
Worked example (from Promega's technical note [4]). An undiluted dsDNA sample in a 1 cm cuvette reads A260 = 0.9. Concentration = 0.9 × 50 µg/mL = 45 µg/mL dsDNA. If the sample had been diluted before measurement, the result would also be multiplied by the dilution factor [5].
The factors are averages, and anything else that absorbs at 260 nm adds to the reading. Extraction reagents that absorb at 260 nm give falsely high concentrations [4], and the A260/A280 ratio does not necessarily reveal free nucleotides or single-stranded nucleic acid in a double-stranded sample [4]. Keep the reading in the range where absorbance is proportional to concentration; one analytical textbook keeps absorbance within about 0.1–1 for a ±1–2 % relative uncertainty [9]. Our Beer–Lambert guide explains the linear range.
3. Protein Concentration at 280 nm
Protein absorbance at 280 nm also follows A = εbc, but ε varies much more from protein to protein, because it depends on how many tryptophan, tyrosine and cystine residues each contains [4][6]. For a folded protein in water, Pace and co-workers found that ε at 280 nm is best predicted as:
ε(280) = 5,500 × (number of Trp) + 1,490 × (number of Tyr) + 125 × (number of cystines), in M⁻¹ cm⁻¹ [6]
The prediction is quite reliable for proteins that contain tryptophan and less reliable for those that do not, and the authors' advice is to measure ε rather than predict it [6]. Other coefficient sets are in use [4], so record which one you applied. Buffer type, ionic strength and pH also affect protein absorbance at 280 nm [4]. Assuming that one absorbance unit equals 1 mg/mL gives only a very rough estimate [4]. With ε known, molar concentration is A280 divided by ε and the path length.
4. The Warburg–Christian Method for Protein with Nucleic Acid Present
Nucleic acid absorbs at 280 nm as well as at 260 nm, so it inflates a simple A280 protein estimate. The Warburg–Christian method, published in 1941, combines readings at 280 nm and 260 nm in a 1 cm path, each measured against a suitable blank [7]. One published form, from a Merck standard procedure, is:
protein (mg/mL) = (1.31 × A280 − 0.57 × A260) × dilution factor [7]
The same procedure states that A280 must be greater than A260 for a valid result, and that NAD or NADP in the sample must be corrected for [7]. Use the coefficients specified by the method you follow. The result is an estimate for mixtures, not a substitute for a measured extinction coefficient or a calibrated protein assay.
5. Reading the A260/A280 Ratio, and Its Limits
The A260/A280 ratio is simply the absorbance at 260 nm divided by the absorbance at 280 nm. Table 2 summarises the generally accepted values and what a departure can mean.
Table 2. Interpreting purity ratios (rules of thumb)
| Ratio | Generally accepted value | If lower | If higher |
|---|---|---|---|
| A260/A280, DNA | ~1.8 [1] | protein, phenol or another contaminant absorbing at or near 280 nm [1][2]; acidic solution [1] | not necessarily a problem; a very high value can suggest a poor blank [2]; basic solution [1] |
| A260/A280, RNA | ~2.0 [1] | as for DNA [1][2] | as for DNA [1][2] |
| A260/A230 | commonly 2.0–2.2 [1] | contaminants absorbing near 230 nm, such as EDTA, carbohydrates, phenol or guanidine hydrochloride [1] | — |
Several factors move the ratio even when the sample itself has not changed:
- pH and ionic strength. Wilfinger and co-workers found that RNA measured in water at about pH 5.4 gave ratios of about 1.5, rising to about 2.0 at a slightly alkaline pH of 7.5–8.5; both pH and ionic strength influenced the ratio, and protein contamination was easier to detect in alkaline solution [3]. They found ratios more reliable and reproducible in 1–3 mM Na₂HPO₄ at pH 8.0–8.5 [3]. Thermo Fisher's bulletin puts the effect at 0.2–0.3: acidic solutions read low and basic solutions read high [1].
- Wavelength accuracy. Nucleic-acid absorbance at 260 nm sits on a plateau, but the curve at 280 nm is steep, so a ±1 nm wavelength shift changes the ratio by about ±0.2 [1]. Two instruments that both meet a 1 nm accuracy specification can differ by as much as 0.4 on the same sample [1][2]. Our spec-sheet guide explains how wavelength accuracy is specified.
- Composition. The values 1.8 and 2.0 are rules of thumb; the real ratio depends on the nucleic acid's base composition [1].
- Blank and concentration. A poor blank can remove too much signal near 280 nm and push the ratio up, and ratios are less reliable at very low nucleic-acid concentrations [2].
Most important, a ratio inside the expected range does not guarantee a good sample. Thermo Fisher notes that ratios are sometimes within limits while the sample still has a problem, and that the best indicator of DNA or RNA quality is how well it performs in the downstream application [2]. The ratio flags likely contamination; it does not prove purity.
6. The A260/A230 Ratio and What Absorbs at 230 nm
A260/A230 is a secondary purity check. For clean nucleic acid it is often higher than A260/A280, commonly 2.0–2.2 [1]. A lower value suggests something that absorbs at 230 nm. EDTA, carbohydrates and phenol all absorb near 230 nm; the phenol-based reagent TRIzol absorbs at 230 nm and at about 270 nm; guanidine hydrochloride, used in DNA isolation, absorbs near 230 nm, while guanidine isothiocyanate, used for RNA, absorbs near 260 nm [1]. Residual phenol and guanidine are also common causes of a low A260/A280 [2]. Reagents that absorb close to 260 nm can inflate an A260 concentration as well [4], so a full spectral scan, rather than three single readings, often makes the contaminant easier to identify [2].
7. Background Correction at 320 nm
One open teaching protocol gives an optional 320 nm reading that is subtracted from the A260 and A280 values [5]. The corrected ratio is then (A260 − A320) / (A280 − A320), and the corrected A260 is used for concentration. The rationale is consistent with general UV-Vis practice: suspended particles scatter light and can create apparent background absorbance [8]. Because scattering changes with wavelength [8], subtracting a single A320 value is only an approximate background correction for 260 and 280 nm. If scattering is appreciable, removing suspended material where appropriate is preferable to relying on the correction; filtration is one method described for reducing scattering [8]. For samples in which scattering is a large part of the signal, see our graphene concentration guide.
8. Measuring Well and Choosing an Instrument
Blank with your buffer, not water. The blank should be the solution the sample is dissolved in, and Thermo Fisher stresses keeping the pH and ionic strength the same when readings are compared [1][2]. Dilute samples in that same buffer; because of the pH effect described above, a low-concentration buffer at slightly alkaline pH gives more reproducible nucleic-acid ratios than unbuffered water [3]. Blanking technique is covered in our cuvette guide.
Use a UV-transparent cell. Glass absorbs strongly below 320 nm and is not suitable for measurements there; fused quartz cells are reasonably transparent down to about 210 nm, and cells of high-purity synthetic silica down to about 190 nm [8]. For readings at 230, 260 and 280 nm, use quartz or a cell rated for the UV; our quartz vs glass vs plastic cuvette guide compares materials.
Keep conditions constant. Dilute samples that read high so they fall in the working range [9], and measure samples and any standards at the same temperature, since heating double-stranded DNA raises its absorbance at 260 nm [8].
Bandwidth is usually not the limiting factor. Absorption bands of samples in solution are normally broad, and for about 99 % of routine measurements a spectral bandwidth of 2 nm is more than adequate for bands 20 nm wide or more [8]. Agilent's primer lists natural bandwidths of 20–45 nm for compounds that include adenosine and tryptophan [10], the same chromophores that dominate 260 and 280 nm readings [6][8]. A narrower bandwidth is therefore not generally needed for routine A260/A280 work.
Choosing an instrument. The instrument must reach 230 nm and below with a UV source. The ALab™ single-beam, touch-screen SP-UV2102 and double-beam, touch-screen SP-UV3101 both have a specified wavelength range of 190–1100 nm, which covers 230, 260, 280 and 320 nm, and both use tungsten and deuterium lamps. Both include a DNA/protein test among their measurement functions; what that function calculates is not described, so work out the ratios and corrections above from the absorbance readings. The SP-UV2102 comes with a manual four-position 1 cm holder as standard, and the SP-UV3101 with a single-position 1 cm holder. The double-beam SP-UV3102 and the double-beam SP-XUV5101, which uses a xenon lamp, are further options. Their listed spectral bandwidths are 2.0nm or 1.0nm (Table 3); either is suitable for broad nucleic-acid and protein bands. For beam design see single-beam vs double-beam spectrophotometers; for a full comparison see how to choose a UV-Vis spectrophotometer.
Table 3. Wavelength range, bandwidth and standard holder
| Model | Beam | Light source | Wavelength range | Spectral bandwidth | Standard holder |
|---|---|---|---|---|---|
| SP-UV2102 | Single Beam | tungsten and deuterium lamps | 190–1100 nm | 2.0nm | Manual 4-position 1cm holder (standard for single beam) |
| SP-UV3101 | Double Beam | tungsten and deuterium lamps | 190–1100 nm | 1.0nm | Single hole 1cm holder (standard for double beam) |
| SP-UV3102 | Double Beam | tungsten and deuterium lamps | 190–1100 nm | 2.0nm | Single hole 1cm holder (standard for double beam) |
| SP-XUV5101 | Double Beam | xenon lamp | 190–1100 nm | 1.0nm | Single hole 1cm holder (standard for double beam) |
Source: ACS Material product specifications (October 2026). Both models include a DNA/protein test function; A260/A280, purity-ratio, background-correction and sample-volume figures are not specified. Nucleic-acid and protein bands are broad, so either bandwidth is suitable [8][10]. The 1 cm figure describes the holder, not a path-length specification.
9. Frequently Asked Questions
What is a good A260/A280 ratio?
About 1.8 is generally accepted for DNA and about 2.0 for RNA [1]. These are rules of thumb that depend on base composition, pH and the instrument [1].
Why is my A260/A280 ratio low?
Common causes are protein, phenol or another extraction reagent absorbing at or near 280 nm [1][2], an acidic solution [1], or a very dilute sample [2]. Check the full spectrum and the blank.
What does a low A260/A230 ratio mean?
Something in the sample absorbs near 230 nm, such as EDTA, carbohydrates, phenol or guanidine hydrochloride [1].
How do I calculate DNA concentration from absorbance?
In a 1 cm path, multiply A260 by the dilution factor and by 50 µg/mL for dsDNA, 40 µg/mL for RNA or 33 µg/mL for ssDNA [4][5].
Can I measure protein concentration at 280 nm without knowing ε?
Only roughly: assuming 1 absorbance unit = 1 mg/mL is a very rough estimate [4]. A measured ε, or one predicted from the Trp, Tyr and cystine content, is much better [6].
Should I blank with water or buffer?
Use the buffer the sample is in. pH and ionic strength both shift the ratio [1][3], and RNA read in unbuffered water gave lower ratios than in a slightly alkaline buffer [3].
10. Keep Exploring the UV-Vis Hub
- UV-Vis spectrophotometry guide: how the instrument works and what limits an absorbance reading.
- Beer–Lambert law formula: A = εbc, units, worked examples and the linear range.
- Quartz vs glass vs plastic cuvettes: cell material, path length and blanking.
- Spectral bandwidth, stray light and photometric accuracy: reading the spec sheet.
- Single-beam vs double-beam spectrophotometers: drift, stability and when a reference beam matters.
- How to choose a UV-Vis spectrophotometer: wavelength range, beam design and light source across all models.
- Graphene concentration by UV-Vis: absorbance and scattering in dispersions.