-
Graphene Oxide Transport in 2-D Porous Media — Nanjing University, 2019
May 29, 2026 | ACS MATERIAL LLCDong, S. et al. (2019). Visualization of graphene oxide transport in two-dimensional homogeneous and heterogeneous porous media. *Journal of Hazardous Materials*. https://doi.org/10.1016/j.jhazmat.2019.02.042
Journal of Hazardous Materials · 2019
Researchers at Nanjing University used ACS Material graphene oxide to visualize GO transport, retention and remobilization in 2-D homogeneous and heterogeneous porous media.
About this research
Researchers at Nanjing University, working together with collaborators from the University of Florida, used graphene oxide (GO) purchased from ACS Material (Medford, MA) to deliver the first visualized study of GO transport, deposition, and remobilization in two-dimensional (2-D) homogeneous and heterogeneous porous media. Published in the Journal of Hazardous Materials in 2019, the paper combines light transmission visualization (LTV) with effluent breakthrough curves and a simplified Double Monod reactive-transport model to map how a GO plume migrates through saturated sand tanks under different ionic strength (IS) and grain size conditions. The work provides a direct visual benchmark for the environmental fate of one of the most widely used carbon nanomaterials.
Graphene oxide is now produced at industrial scale for energy storage, composites, water treatment, and biomedical applications. Once released, GO can enter soils and groundwater, where it is toxic to many organisms and can co-transport polycyclic aromatic hydrocarbons, heavy metals, and antibiotics. Prior transport studies were almost exclusively limited to one-dimensional sand columns, which cannot reproduce the lateral spreading, density-driven sinking, and preferential flow that occur in real aquifers. Upscaling to 2-D systems is therefore essential for credible risk assessment. The authors specifically targeted this gap, asking how IS, grain size, and structural heterogeneity jointly govern GO retention and remobilization in geometry that approaches field conditions.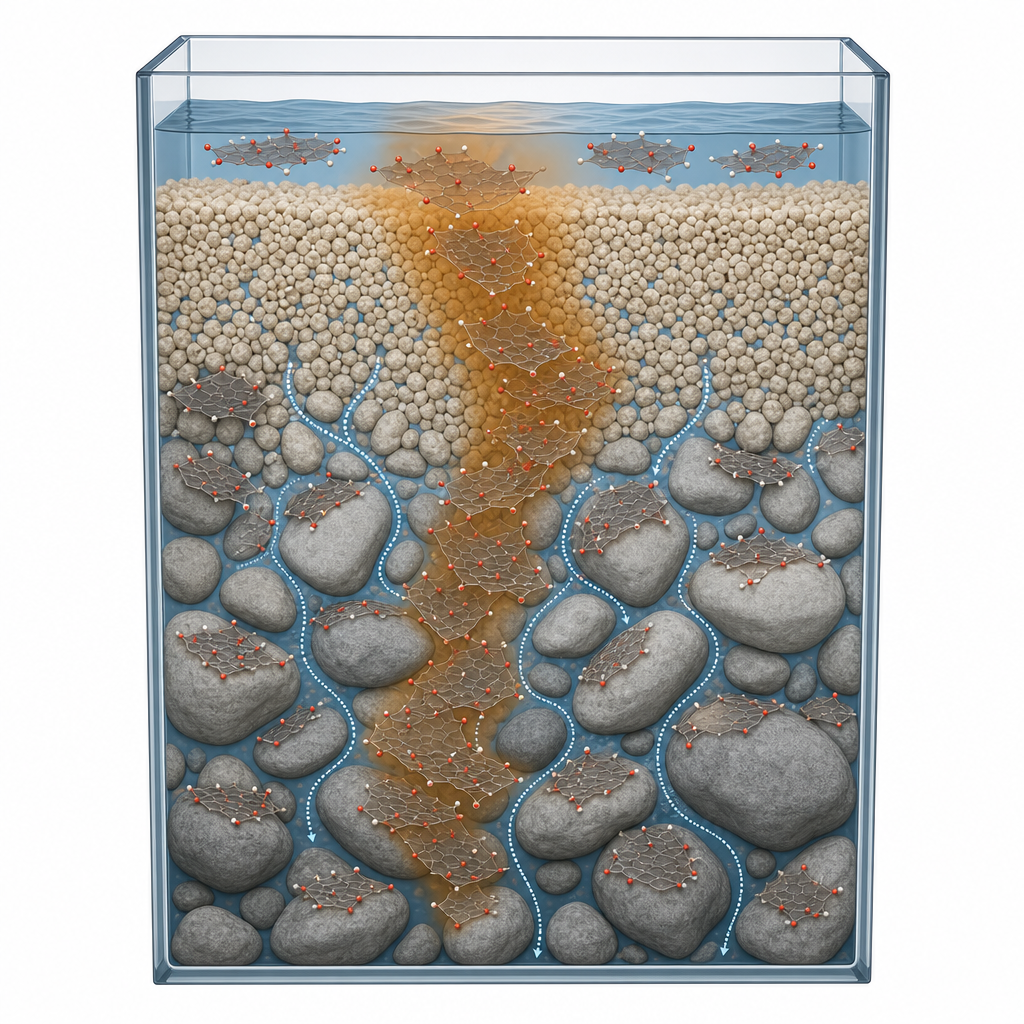 The ACS Material graphene oxide used in the experiments had an average sheet thickness of 0.92 ± 0.13 nm, confirming a near-monolayer product, and TEM characterization (JEM-200CX) showed the expected sheet morphology. A stock dispersion was prepared by sonicating 500 mg of GO in 1000 mL of deionized water for 2 h, then diluted to 200 mg L⁻¹ in 1 mM or 20 mM NaCl electrolyte at pH 5.6. The dispersions remained colloidally stable across the experimental window. GO was injected as a 300 min pulse at 0.5 mL min⁻¹ into a transparent 30 × 20 × 1.4 cm sand tank packed either homogeneously with coarse (700–850 µm) or fine (350–450 µm) quartz sand, or heterogeneously with a fine-sand layer over coarse sand. A thermoelectrically cooled CCD camera captured gray-level images at fixed intervals, which were converted to GO concentration fields via the Beer–Lambert law, while effluent GO was quantified by UV-Vis absorbance at 230 nm.
The visual and quantitative results were strongly coupled. At IS = 1 mM, both coarse and fine homogeneous sand tanks showed essentially no GO retention: plumes expanded, plateaued, and then washed out, with mass recoveries of 99.1% (coarse) and 97.7% (fine). Increasing IS to 20 mM dramatically increased deposition, dropping recoveries to 61.9% and 45.1%, respectively, with LTV images showing pronounced residual GO in the fine-sand tank. The first-order deposition coefficient k rose from 0.00012 to 0.0033 min⁻¹ in coarse sand and from 0.00017 to 0.0047 min⁻¹ in fine sand as IS increased from 1 to 20 mM. Plume-width analysis showed linear scaling with √t early in the experiments, indicating dispersion-dominated vertical spreading; this justified the dispersion-only vertical term in the Double Monod model, which reproduced the breakthrough curves with R² > 0.82. Density-driven sinking, previously reported for surface-stabilized nano-Fe⁰, was negligible for GO, matching XDLVO predictions of unfavorable, secondary-minimum-controlled deposition between negatively charged GO and sand. In heterogeneous tanks, preferential flow and partial entry of GO into low-permeability zones were directly visualized. Subsequent DI water flushing remobilized previously retained GO at 20 mM, confirming that ionic-strength perturbations can release GO back into pore water.
These findings carry direct implications for groundwater protection near sites that manufacture, use, or dispose of graphene-based materials. The visualization framework establishes a quantitative basis for predicting GO plume geometry, depth of penetration, and risk of remobilization during rainfall or freshwater recharge events. It also gives modelers an experimentally validated parameter set (k, D, recovery) for incorporating GO into regional-scale contaminant transport simulations. The same LTV + Double Monod workflow can be extended to reduced graphene oxide, MXenes, carbon nanotubes, and engineered nanoparticle co-transport scenarios, and to media containing clay, iron oxides, or natural organic matter. Future work pointed to by the authors includes 3-D extensions and coupling with biofilm or mineral-coating layers.
For researchers studying environmental nanomaterial fate, the ACS Material graphene oxide used in this study offers a well-characterized, near-monolayer starting material suitable for colloidal transport, sorption, and toxicity experiments. The Graphene Series catalog includes single-layer GO powders, dispersions, and large-size variants that map closely to the product used here, making it straightforward to reproduce or extend these experiments under different chemistries, ionic strengths, or media geometries.How ACS Material products were used
- Graphene Oxide (GO) (Graphene Series) — “GO with the average thickness 0.92 ± 0.13 nm was purchased from ACS Material (Medford, MA)”
Product Performance in this StudyThe ACS Material graphene oxide served as the primary nanomaterial under study. Its monolayer-like thickness (0.92 ± 0.13 nm) and colloidal stability under the tested ionic strengths enabled reliable visualization and quantification of transport, deposition, and remobilization processes in the 2-D sand tanks.
Related product categories
Frequently asked questionsHow does ionic strength affect graphene oxide transport in groundwater sand?
In this 2-D sand-tank study, raising NaCl ionic strength from 1 mM to 20 mM dropped GO mass recovery from above 97% to 45–62%, and the first-order deposition coefficient rose by more than an order of magnitude. Higher ionic strength compresses the electrical double layer between negatively charged GO sheets and sand grains, enabling secondary-minimum deposition predicted by XDLVO theory and significantly reducing GO mobility.
Why use light transmission visualization to study nanoparticle transport in porous media?
Light transmission visualization (LTV) gives a near-instantaneous, high-density 2-D map of contaminant concentration across a transparent sand tank using only a CCD camera and a uniform light source. It requires minimal specialized equipment, captures plume shape, preferential flow paths, and remobilization events that 1-D column breakthrough curves miss, and converts gray-level images to concentration via the Beer–Lambert law.
What grade of graphene oxide is suitable for environmental colloidal transport experiments?
A near-monolayer GO with well-defined sheet thickness and stable aqueous dispersion is preferred. The cited study used GO with an average thickness of 0.92 ± 0.13 nm purchased from ACS Material, dispersed by sonication at 200 mg L⁻¹ in 1–20 mM NaCl at pH 5.6. This grade remained colloidally stable throughout the experiment and produced clean, quantifiable plumes for both UV-Vis breakthrough and LTV imaging.