-
MoS2 Powder for Polymer Composite IR Thermography - UT Rio Grande Valley, 2023
Jul 02, 2026 | ACS MATERIAL LLCRahman, M. A., Rahman, M. M., & Ashraf, A. (2023). Automatic dispersion, defect, curing, and thermal characteristics determination of polymer composites using micro-scale infrared thermography and machine learning …. *Scientific Reports*. https://doi.org/10.1038/s41598-023-29270-z
Scientific Reports · 2023
Researchers at UT Rio Grande Valley used ACS Material MoS2 powder as a filler tracer in IR thermography and machine learning analysis of polymer composites.
About this research
Researchers at the University of Texas Rio Grande Valley used Molybdenum Disulfide (MoS2) powder supplied by ACS Material LLC as a filler tracer to validate a new infrared-thermography and machine-learning workflow that automatically quantifies dispersion, defects, curing, and thermal diffusivity of graphite/graphene polymer composites. Published in Scientific Reports (2023), the study by Md Ashiqur Rahman, Mirza Masfiqur Rahman, and Ali Ashraf demonstrates micro-scale thermal imaging at roughly 20 µm per pixel coupled with a Fourier Neural Operator–based model called SDFN. The combined platform discriminates fillers, voids, and tramp material from artifacts in noisy thermal images, enabling real-time, non-destructive composite quality control.
Polymer composites underpin aerospace, automotive, marine, and energy applications, but their performance hinges on how uniformly fillers are dispersed within the polymer matrix. Conventional dispersion analysis relies on TEM or SEM, both of which are destructive, slow, and limited to small sample areas. Acoustic microscopy and lock-in thermography improve coverage but remain operator-intensive. There is therefore a clear need for a non-destructive evaluation method that delivers quantitative dispersion metrics over realistic sample sizes, tolerates manufacturing artifacts, and runs fast enough for production lines. Infrared thermography offers the right physics—filler and matrix differ in emissivity and thermal diffusivity—but image artifacts, defocus, and tramp material have historically forced manual interpretation. Closing that gap is exactly what this study set out to do, with carbon fillers (graphite, graphene) and an emissivity-distinct second-phase tracer (MoS2) supplying the test cases.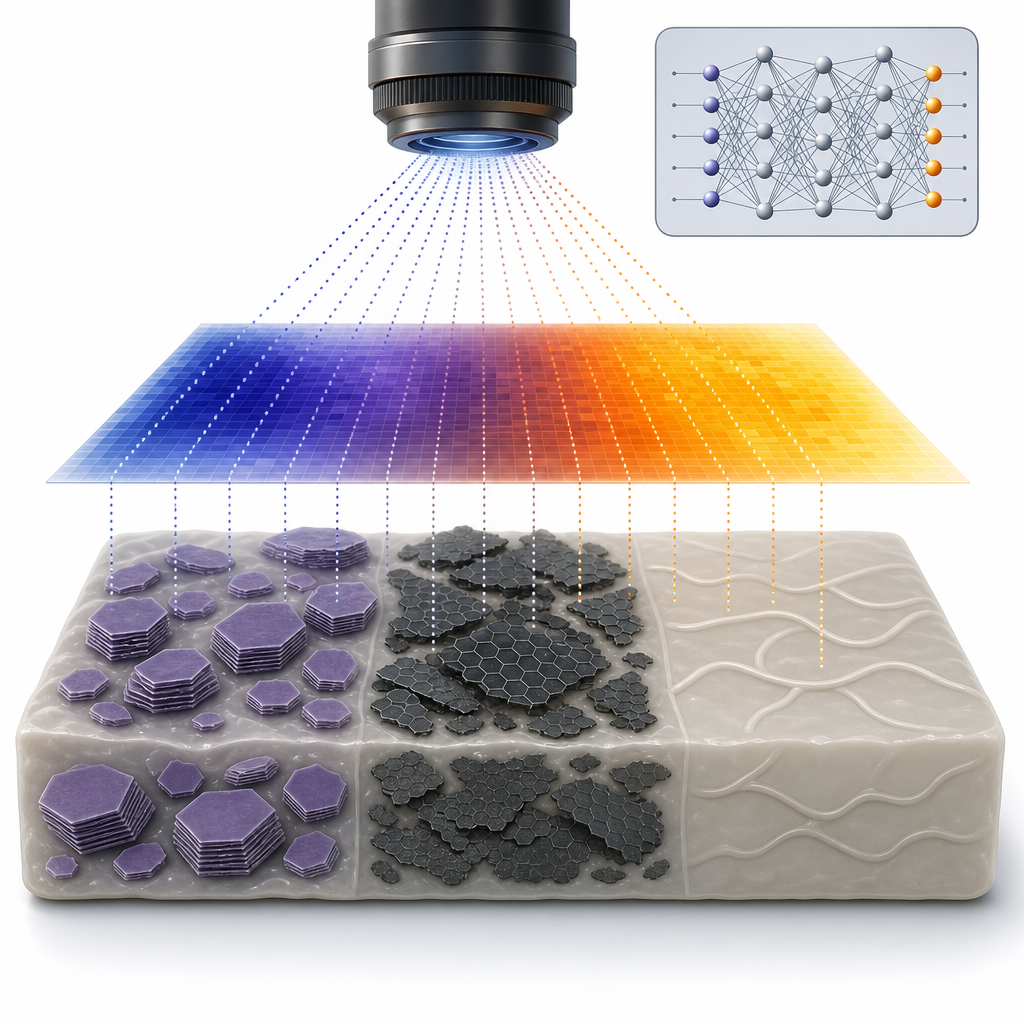
The ACS Material MoS2 powder (particle size ~1.5 μm) was used to fabricate elastomer composites with deliberately segmented regions: one zone containing only MoS2, one zone containing graphite, and one zone with no filler. Because MoS2 has a markedly different emissivity from both the elastomer and from carbon fillers, it appeared in the IR thermograms as a region with a lower average pixel temperature than the polymer matrix, while graphite regions showed higher pixel temperatures. This three-phase test sample (described in supplementary Fig. S4) provided ground-truth validation that the thermography pipeline could discriminate genuinely distinct materials—not just contrast variation—in a single field of view. MoS2 was also incorporated into PDMS for curing-kinetics measurements, allowing the team to record how a high-emissivity inorganic filler alters the exothermic temperature trajectory during cure. Imaging used a Fluke RSE600 thermal camera (640 × 480, 60 Hz, 40 mK sensitivity) with a micro-lens, while heating was supplied by a SpotIR Model 4150 with Arduino-controlled pulse durations.
The SDFN model achieved training losses near 0.06 after exposure to 500 labeled thermal images and produced predicted dispersion maps that closely matched manually thresholded ground truth even when only 50 training images were used. For 40 wt% graphite Ecoflex composites, batch mixing gave the lowest dispersion index (DI) of 0.07, compared with 0.0865 for planetary mixing and 0.163 for hand mixing, confirming that shear-exfoliation batch mixing produces the most homogeneous filler distribution. Surface-dispersion percentages (Aflake/Atotal) were 6.75% for high-graphite hand mixing, 9.56% for planetary mixing, and 25.49% for batch mixing, the last consistent with graphene generation from graphite during high-shear processing. Raman spectroscopy of the batch-mixed sample yielded an I2D/IG ratio of 0.52, indicating few-layer graphene formation. In curing studies, neat PDMS reached cure in ~500 s, PDMS-MoS2 in ~520 s, PDMS with graphite powder in ~800 s, and PDMS with graphene or graphite flake in ~950 s, illustrating how filler type and size shift cure kinetics through changes in heat transport and reaction-rate constants. Thermal characteristic curves separated 2.5–7.5% graphite Dragon Skin samples by mixing method, with planetary samples showing tighter temperature-rise envelopes than hand-mixed samples.
The combined IR-thermography and SDFN workflow is well suited to inline quality control of polymer nanocomposites used in aerospace structures, automotive lightweighting, wind-energy blades, EMI shielding, and thermal-management interfaces. By providing a quantitative dispersion index alongside automatic void, flaw, and tramp-material identification, it offers a faster, lower-cost alternative to TEM/SEM-based dispersion audits and a more automated route than manual lock-in thermography. The authors explicitly identify in-depth defect mapping as the next step, suggesting compatibility with through-thickness flaw inspection for thicker composite parts. The use of a well-characterized inorganic filler such as MoS2 as a calibration tracer also opens a path toward standardized emissivity references for thermography-based composite metrology.
For researchers developing similar non-destructive evaluation pipelines, sintered electrodes, lubricant additives, or 2D-material composites, micrometer-scale MoS2 powder is available from ACS Material in the Graphene-like Materials catalog. The same vendor supplies the graphite, graphene, and h-BN forms used as primary fillers across this field, making it straightforward to assemble matched material sets for thermography calibration, dispersion benchmarking, and composite formulation studies.How ACS Material products were used
- Molybdenum Disulfide (MoS2) Powder (Graphene-like Materials) — “Molybdenum Disulphide (MoS2-Powder size 1.5 μm) was provided by ACS Materials LLC.”
Product Performance in this StudyMoS2 powder (1.5 μm) served as a distinct filler material in elastomer composites and was clearly identified by infrared thermography due to its emissivity contrast against the polymer matrix. It enabled validation of the tramp-material detection method and was used in PDMS curing studies, where PDMS-MoS2 reached curing in ~520 s.
Related product categories
Frequently asked questionsWhy use MoS2 powder as a tracer in infrared thermography of polymer composites?
MoS2 has a different infrared emissivity from both elastomer matrices and carbon fillers, so MoS2-containing regions appear at a distinctly lower average pixel temperature in thermal images than polymer or graphite regions. This contrast lets researchers validate that a thermography algorithm is identifying genuine compositional differences rather than just brightness variation, which is critical when training machine-learning models to detect voids and tramp materials.
How does batch mixing compare to planetary and hand mixing for graphite dispersion in elastomers?
In this study of 40 wt% graphite Ecoflex composites, batch mixing produced the lowest dispersion index of 0.07, followed by planetary mixing at 0.0865 and hand mixing at 0.163, where lower values indicate more uniform filler distribution. Batch mixing also exfoliated some graphite into few-layer graphene, confirmed by a Raman I2D/IG ratio of 0.52, leading to a measured surface dispersion of approximately 25.5% versus 9.6% for planetary and 6.8% for hand mixing.
What advantages does IR thermography with machine learning offer over TEM or SEM for dispersion analysis?
Infrared thermography is non-destructive, fast, and works on full-size samples, whereas TEM and SEM require destructive sample preparation and only image small regions. By combining micro-scale IR imaging with a Fourier Neural Operator model, this work automates filler, void, and tramp-material identification at roughly 20 µm resolution, tolerates image artifacts, and outputs a quantitative dispersion index suitable for in-line composite quality control.