A UV-Vis spectrophotometer measures how much light a sample absorbs at each wavelength, and almost every specification on its data sheet describes one part of that job: which wavelengths it can reach, how narrow a slice of light it selects, how it keeps the reading steady, and what produces the light in the first place. Choosing one is easier if you take those four questions in order and match each to your own samples, rather than starting from the most impressive number. This guide works through them, then sets out 10 ALab™ models in one static table, using only their product specifications.
Quick answer: Decide in this order. (1) Wavelength range: if any of your work sits in the ultraviolet, such as nucleic acids or proteins, you need a UV-capable instrument and UV-transparent cuvettes; visible-only work can use a visible model. (2) Spectral bandwidth: match it to your narrowest absorption band. Most solution samples have broad bands, and 2.0 nm is adequate for them; 1.0 nm matters mainly for narrow bands. (3) Beam design: single-beam suits short routine readings with a fresh blank; double-beam is worth considering for long kinetic runs and repeated scans. (4) Light source: tungsten plus deuterium lamps and a single xenon lamp both cover the UV and visible. Then check stray light, the interface and the sample holders. Where a value is not specified, ask us before you order.
1. Four Questions, in Order
A teaching lab reading coloured solutions, a molecular biology group checking nucleic acid samples and a materials lab scanning dispersions ask different things of the same instrument. The four questions below are a static flowchart: each answer narrows the field to a group of instruments, not to a single model.
- Do any of your measurements fall in the ultraviolet? No → a visible-only instrument is enough. Yes → a UV-capable instrument (Section 2).
- How narrow is the narrowest absorption band you need to resolve? Broad bands → consider 2.0 nm; 4.0 nm may suit sufficiently broad features after checking the one-tenth rule. Narrow bands or fine structure → consider 1.0 nm (Section 3).
- How long are your runs, and how often can you re-blank? Short readings with a fresh blank → single-beam. Long kinetics or repeated scans → consider double-beam (Section 4).
- If double-beam: which light source? Tungsten plus deuterium lamps, or a xenon lamp (Section 5).
Then check stray light (Section 6), the interface (Section 7) and the sample holders (Section 8). Section 9 maps the answers to five groups and the full table.
2. Wavelength Range: Does Your Work Need the UV?
Start with the wavelengths your samples actually require. Many routine assays read in the visible, where coloured complexes and dyes absorb. Others depend on the ultraviolet: nucleic acids are usually read near 260 nm [1][2] and proteins near 280 nm [3], and many common organic chromophores have their absorption maxima below 300 nm [1]. If even one regular method sits in the UV, the instrument has to reach it.
In the ALab™ range the split is clear. Two models are visible-only, with tungsten-lamp light sources: the SP-V1000 is listed at 325–1000nm and the SP-V1100 at 320–1100nm. They are suited to visible-region work and are not instruments for 260 nm or 280 nm measurements. The UV-capable models add a deuterium lamp or use a xenon lamp, and list 200–1000nm (SP-UV1000), 190–1100nm (SP-UV1100) or 190–1100 nm (the SP-UV2102 and the four double-beam models).
Two practical points follow. First, the instrument's range is only half the story: glass cuvettes absorb strongly in the UV, so UV work also needs quartz (fused silica) cells [1][2]; see Section 8 and our guide to quartz, glass and plastic cuvettes. Second, the ends of any range are where performance is hardest to hold: lamp output and detector response fall off there, and stray-light effects are greater at the extremes of the lamp and detector operating ranges [1]. If your key wavelength sits near the edge of a listed range, ask us about performance at that wavelength.
One model needs a separate note. The SP-UV2101 is a single-beam, touch-screen instrument; this guide does not state its wavelength range or place it in either the UV or the visible group; please see its product page for current details.
3. Spectral Bandwidth: 4.0, 2.0 or 1.0 nm?
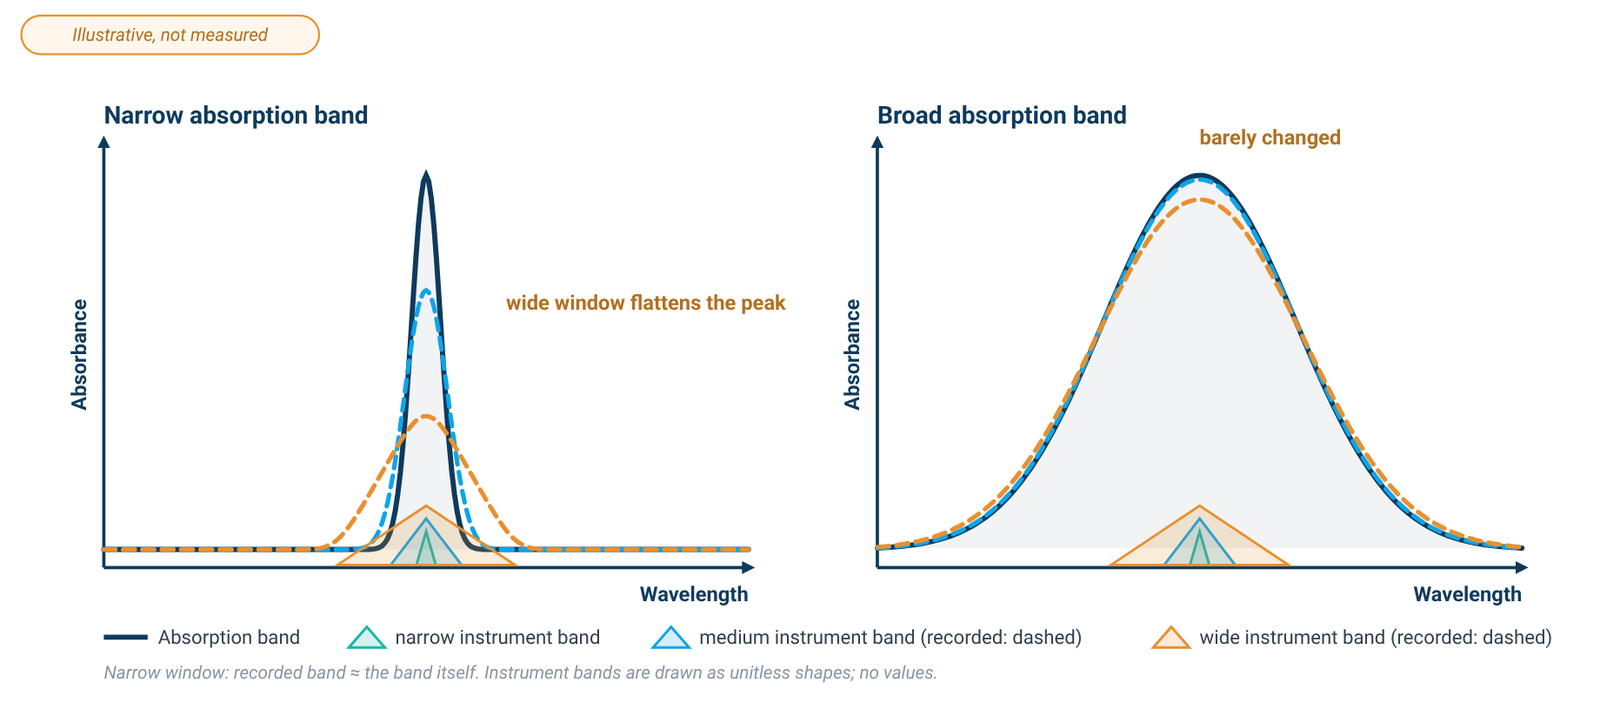
Spectral bandwidth describes how wide a slice of wavelengths the monochromator passes at any setting. A narrower slice follows a sharp peak more faithfully; a wider slice lets more light through, which helps the signal-to-noise ratio. The working rule of thumb is that the spectral bandwidth should be no more than about one-tenth of the natural width of the absorption band you are measuring; within that limit, peak height and shape are recorded with little error [1][2].
That rule matters for choosing, because most samples in solution have broad bands. The bands of nucleotides, proteins and common dyes are often 20 nm wide or more [1][2], so a 2.0 nm bandwidth can meet the one-tenth rule for those broad bands. A 4.0 nm bandwidth may also be suitable for visible-region work when the particular absorption band is sufficiently broad. (Graphene oxide dispersions, for comparison, show a main absorption maximum near 231 nm and a shoulder near 300 nm [4].) A 1.0 nm bandwidth earns its place with narrow features: holmium or didymium wavelength-check standards and the fine structure of benzene [2]. If your work is routine quantification of broad bands, a 1.0 nm model is not needed on bandwidth grounds alone.
ALab™ models come in 4.0nm (SP-V1000, SP-UV1000), 2.0nm (SP-V1100, SP-UV1100, SP-UV2102, SP-UV3102, SP-XUV5102) and 1.0nm (SP-UV2101, SP-UV3101, SP-XUV5101). These are nominal values. Nominal bandwidth is not the same as the instrument's measured spectral resolution, which depends on the whole optical system and is not specified for these models. Our guide to reading a spectrophotometer spec sheet covers bandwidth, stray light and photometric accuracy one by one.
4. Beam Design: Single or Double?
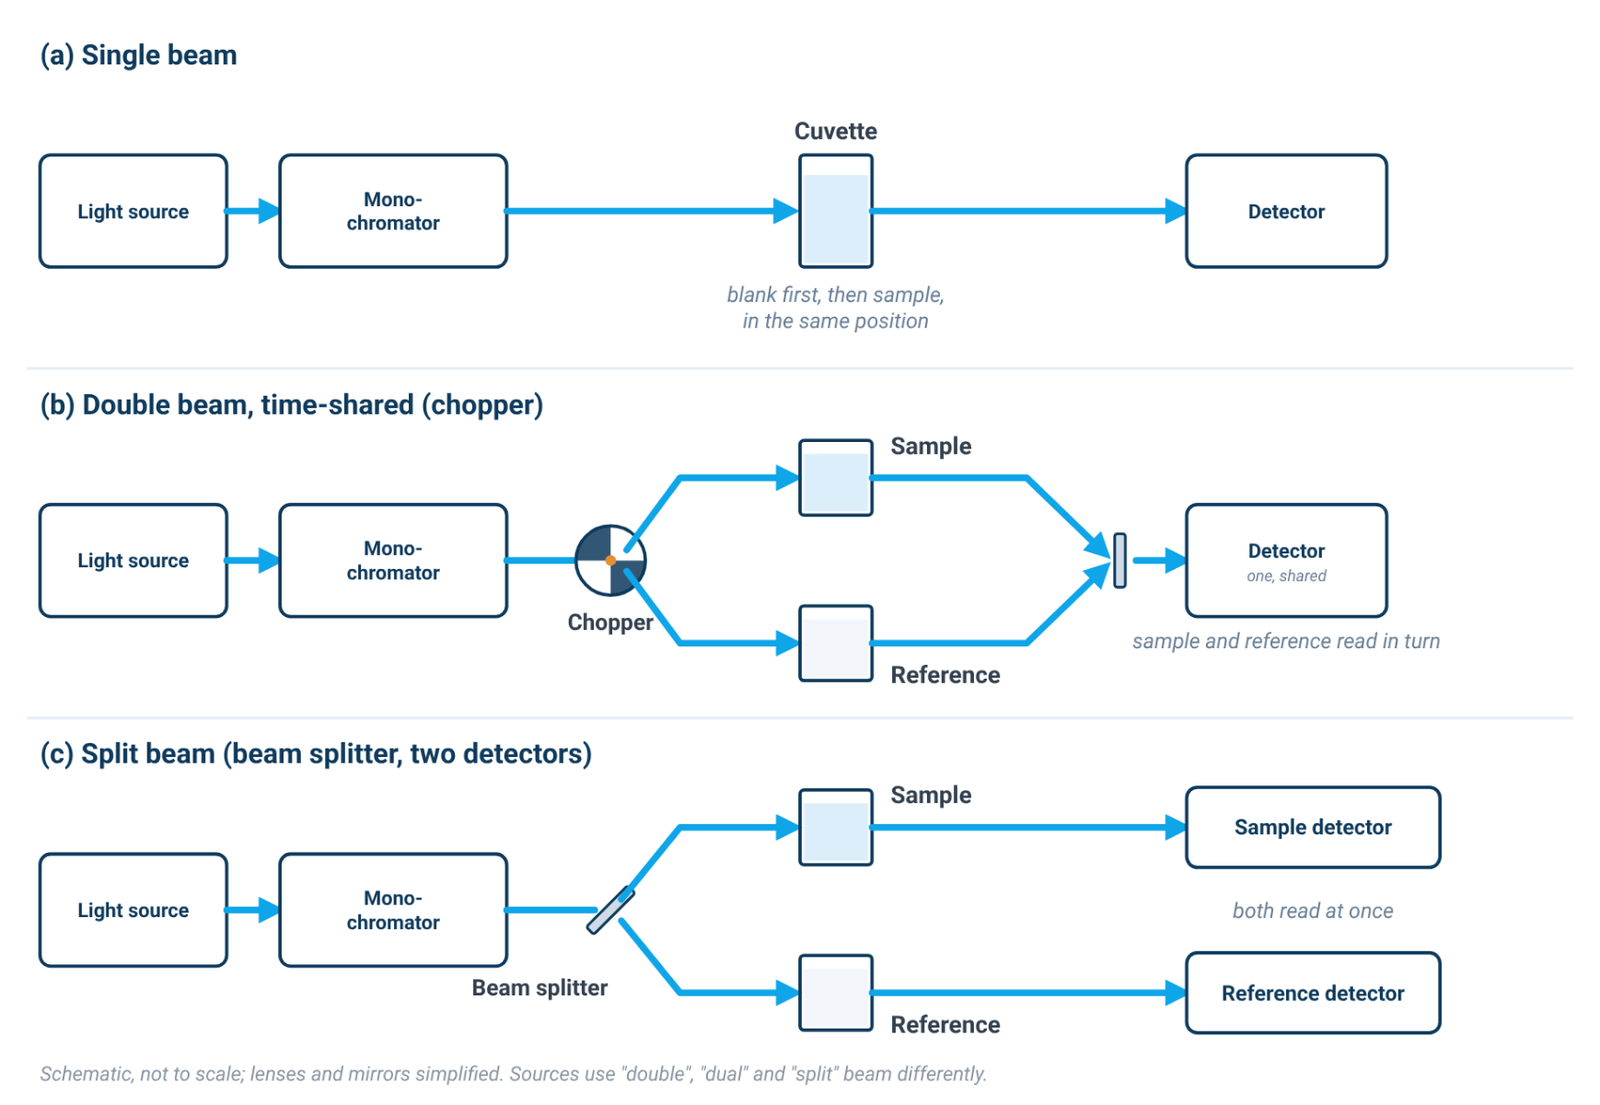
In a single-beam instrument, one beam passes through one cuvette position at a time. You measure the blank, then the sample, and the absorbance is calculated from the two readings. Anything that changes between those readings (lamp output, detector or electronics drift) appears as error in the result [1][2]. For short readings with a fresh blank, this is rarely a problem.
In a double-beam instrument, the light is split into a sample beam and a reference beam, and the two are compared almost continuously. This compensates for drift in the source and the electronics during a measurement, which is most useful in long kinetic runs and repeated wavelength scans [1][2]. It does not correct anything happening in the sample itself: temperature changes, evaporation, sedimentation of a dispersion or a slow reaction still show up, as they should.
The clearest like-for-like pair in the ALab™ range is the single-beam SP-UV2102 and the double-beam SP-UV3102. Both have a 2.0nm spectral bandwidth, the same photometric accuracy and tungsten plus deuterium lamps, and both have the same stability figure: ≤0.001 A/h at 500 nm after 1 hour of preheating. They differ in beam design, in the standard cell holder (a manual 4-position 1cm holder on the single-beam model, a single hole 1cm holder on the double-beam model) and in stray light: ≤0.05%T @ 220,360nm for the SP-UV2102 and ≤0.03%T @ 220,360nm for the SP-UV3102. Stray light is a property of the monochromator and optics rather than of the beam arrangement, so that difference should be read as a separate specification, not as a benefit of double-beam design. Because the stability specifications are identical, they do not show a drift advantage for either model; the choice rests on how you work. Our single-beam vs double-beam comparison goes further into when a reference beam matters.
5. Light Source: Tungsten and Deuterium, or Xenon?
No single conventional lamp is bright across the whole UV-Vis range. The classic arrangement pairs a deuterium lamp for the ultraviolet with a tungsten (often tungsten-halogen) lamp for the visible and near-infrared [1][2]. A xenon lamp is a single source whose output spans both the UV and the visible [1].
In the ALab™ range, the visible-only SP-V1000 and SP-V1100 use a tungsten lamp; the SP-UV1000, SP-UV1100, SP-UV2102, SP-UV3101 and SP-UV3102 use tungsten and deuterium lamps; and the SP-XUV5101 and SP-XUV5102 use a xenon lamp. These entries identify the light sources, not a measured performance advantage.
Each xenon model has the same specified wavelength range, spectral bandwidth, stray light and photometric accuracy as its tungsten-and-deuterium counterpart (SP-XUV5101 with SP-UV3101, SP-XUV5102 with SP-UV3102), so the specifications do not separate them. Choose on how the lamp arrangement fits your workflow, and ask us about warm-up, lamp replacement and running costs, which are not specified.
6. Secondary Checks: Stray Light and Photometric Accuracy
Stray light is light outside the selected band that still reaches the detector. Its effect is largest when little light gets through the sample: at high absorbance, and in the low UV, where source output is weak and many solvents and cuvettes absorb [1]. Stray light makes the measured absorbance read lower than the true value and bends a calibration curve away from the Beer–Lambert line [1][2]. This is one reason quantitative work is usually kept at moderate absorbance: in one published error analysis combining stray light and noise, readings from roughly 0.3 to 1.0 A gave the highest accuracy and precision, and the usable range always depends on the instrument and the sample [1]; our Beer–Lambert law formula guide explains the linear range.
Stray light is specified at particular wavelengths, so compare like with like. The SP-1000/1100 series is specified at ≤0.2%T @ 360nm for the SP-V1000 and SP-UV1000, ≤0.05%T @ 360nm for the SP-V1100 and ≤0.05%T @ 220 & 360nm for the SP-UV1100. The touch-screen models list values @ 220,360nm, from ≤0.05%T (SP-UV2102) and ≤0.03%T (SP-UV2101, SP-UV3102, SP-XUV5102) to ≤0.02%T (SP-UV3101, SP-XUV5101). A value at 220 nm says more about low-UV performance than a value at 360 nm alone.
Photometric accuracy is how closely the reported absorbance matches a reference value, and it is specified at defined absorbance levels: for example, ±0.0015A(0–0.5A) ±0.002A(0.5A–1A) for the SP-UV3101 and ±0.002A(0–0.5A) ±0.003A(0.5A–1A) for the SP-UV3102. Keep each difference separate. Between the SP-UV3101 and SP-UV3102, the bandwidth, stray light and photometric accuracy all differ, so no single specification explains the others.
The photometric range (−0.3 to 3 A for the touch-screen models; −0.3 to 3.0 A and 0–200 %T for the SP-1000/1100 series) is the span the instrument can display. It is not the range over which absorbance stays proportional to concentration. That linear range depends on stray light, bandwidth relative to the band and the sample itself, and is not specified for any model.
7. Interface, Software and Data
The four models in the SP-1000/1100 series use a Dot Matrix LCD. Their built-in functions are photometric measurement, quantitative test and kinetics measurement, and they work with computer software to which functions such as wavelength scanning, time scanning (kinetics), multi-wavelength scanning and DNA/protein detection analysis can be added. It also lists automatic wavelength calibration and dark current correction.
The six touch-screen models use a 10.1-inch large color touch screen(1024×600). Their functions include photometric measurement, quantitative measurement, kinetics, spectrum scan, a DNA/protein test and multi-wavelength test, plus USB storage. These are function names. How each function calculates its result is not described, so if your method depends on a specific calculation, such as a purity ratio with background correction, confirm it with us. Our A260/A280 guide explains what such a calculation involves.
The touch-screen models also offer user management, logging, data tracking and exporting, described under a GLP/GMP heading. Whether any configuration meets your laboratory's regulatory requirements is a question for us and your quality team; this guide makes no compliance claim.
8. Sample Holders and Cuvettes
The standard holder follows the beam design. The single-beam models come with a manual four-position 1 cm holder, which lets you load a blank and several samples and step through them. The double-beam models come with a single-position 1 cm holder. The standard holder does not tell you which cuvettes are bundled. Confirm the supplied cuvette materials, optical path lengths and quantities against the model quotation; package contents for the SP-1000/1100 series are not specified.
The glass cuvettes are for visible-region work only. Below roughly 320 nm, glass absorbs too strongly to give a usable blank, so UV measurements need quartz cells [1]; some sources place the practical lower limit of optical glass nearer 334–350 nm [2]. Plastic cuvettes vary by polymer: polystyrene cells are typically limited to about 340 nm and above, while PMMA (acrylic) cells reach down to about 300 nm [1][2]. A listed holder also does not guarantee that every cell material, path length or geometry will fit. If you use micro, long-path or special cells, check compatibility first. Optional accessories are available (for the touch-screen models: automatic cell holder, thermostatic automatic sampler, adjustable micro cell holder, reflection accessory and integrating sphere; for the SP-1000/1100 series: automatic cell holder, film holder, tube rack, constant temperature cell holder, reflectivity accessory, variable optical path sample holder and variable angle solid sample holder), but their performance is not specified, so treat them as items to discuss at quotation.
9. Five Groups and the Full Table
The groups below are editorial and do not rank products. Each gathers models that answer the four questions the same way. The single-beam, touch-screen SP-UV2101 is listed in the table only (see note ¹).
- G1 — Visible-only, single-beam, LCD: SP-V1000, SP-V1100. For visible-region assays; not for UV work.
- G2 — UV-Vis, single-beam, LCD with PC software: SP-UV1000 (4.0nm), SP-UV1100 (2.0nm). Routine UV and visible readings.
- G3 — UV-Vis, single-beam, touch screen: SP-UV2102 (2.0nm).
- G4 — UV-Vis, double-beam, tungsten and deuterium lamps, touch screen: SP-UV3101 (1.0nm), SP-UV3102 (2.0nm).
- G5 — UV-Vis, double-beam, xenon lamp, touch screen: SP-XUV5101 (1.0nm), SP-XUV5102 (2.0nm).
Within a group, the main choice is usually bandwidth; apply the one-tenth rule from Section 3 first.
nucleic acids280 nm
proteins
| Model | Beam | Wavelength range | Spectral bandwidth | Stray light | Light source | Display | Standard cell holder |
|---|---|---|---|---|---|---|---|
| SP-V1000 | Single Beam | 325–1000nm | 4.0nm | ≤0.2%T @ 360nm | Tungsten lamp | Dot Matrix LCD | Manual 4-position 1cm holder (standard for single beam) |
| SP-UV1000 | Single Beam | 200–1000nm | 4.0nm | ≤0.2%T @ 360nm | Tungsten + deuterium lamps | Dot Matrix LCD | Manual 4-position 1cm holder (standard for single beam) |
| SP-V1100 | Single Beam | 320–1100nm | 2.0nm | ≤0.05%T @ 360nm | Tungsten lamp | Dot Matrix LCD | Manual 4-position 1cm holder (standard for single beam) |
| SP-UV1100 | Single Beam | 190–1100nm | 2.0nm | ≤0.05%T @ 220 & 360nm | Tungsten + deuterium lamps | Dot Matrix LCD | Manual 4-position 1cm holder (standard for single beam) |
| SP-UV2101 | Single Beam | See product page¹ | 1.0nm | ≤0.03%T @ 220,360nm | Tungsten + deuterium lamps | 10.1-inch large color touch screen(1024×600) | Manual 4-position 1cm holder (standard for single beam) |
| SP-UV2102 | Single Beam | 190–1100 nm | 2.0nm | ≤0.05%T @ 220,360nm | Tungsten + deuterium lamps | 10.1-inch large color touch screen(1024×600) | Manual 4-position 1cm holder (standard for single beam) |
| SP-UV3101 | Double Beam | 190–1100 nm | 1.0nm | ≤0.02%T @ 220,360nm | Tungsten + deuterium lamps | 10.1-inch large color touch screen(1024×600) | Single hole 1cm holder (standard for double beam) |
| SP-UV3102 | Double Beam | 190–1100 nm | 2.0nm | ≤0.03%T @ 220,360nm | Tungsten + deuterium lamps | 10.1-inch large color touch screen(1024×600) | Single hole 1cm holder (standard for double beam) |
| SP-XUV5101 | Double Beam | 190–1100 nm | 1.0nm | ≤0.02%T @ 220,360nm | Xenon lamp | 10.1-inch large color touch screen(1024×600) | Single hole 1cm holder (standard for double beam) |
| SP-XUV5102 | Double Beam | 190–1100 nm | 2.0nm | ≤0.03%T @ 220,360nm | Xenon lamp | 10.1-inch large color touch screen(1024×600) | Single hole 1cm holder (standard for double beam) |
¹ SP-UV2101: its wavelength range is not given here and the model is not grouped as UV-capable or visible-only. Please see the product page for current details.
Source: ACS Material product specifications (October 2026). Final configurations are confirmed at quotation, and the model datasheet gives confirmed model-specific specifications.
10. Checklist Before You Request a Quote
- Wavelengths: list every wavelength your methods use, including the lowest one.
- Narrowest band: estimate its width and apply the one-tenth rule before paying for a narrower bandwidth.
- Run length: note your longest kinetic run or scan series and how often you can re-blank.
- Absorbance level: if your samples read high, plan dilutions into the moderate range, and compare stray light at the low-UV wavelength you use.
- Sample type: scattering samples such as dispersions need extra care with blanks and calibration; see our guide to graphene concentration by UV-Vis.
- Cuvettes and holders: confirm the cell material for your lowest wavelength and that the holder fits your cells.
- Software and data: confirm the functions, calculations and data export your methods require.
- Datasheet: ask for the model datasheet and confirm the configuration on the quotation.
11. Frequently Asked Questions
Do I need a 1.0 nm bandwidth for DNA or protein measurements?
Usually not on bandwidth grounds. Their absorption bands are broad, so 2.0 nm can meet the one-tenth rule for those broad bands [1][2]. A UV-capable range and quartz cuvettes matter more.
Is a double-beam spectrophotometer always better?
No. A reference beam compensates for source and electronics drift during long runs, but it does not correct changes in the sample, and short readings with a fresh blank work well on a single-beam instrument.
Can a visible spectrophotometer measure proteins at 280 nm?
No. A visible-only instrument does not reach 280 nm; the ALab™ visible models start at 325nm (SP-V1000) and 320nm (SP-V1100). You need a UV-capable model and quartz (fused silica) cuvettes suitable for 280 nm measurements.
What is a xenon lamp spectrophotometer?
One that uses a single xenon lamp as its light source across the UV and visible, instead of a tungsten and deuterium lamp pair. In the ALab™ range, the SP-XUV5101 and SP-XUV5102 are double-beam, touch-screen models with a xenon lamp.
Does a wider photometric range mean I can measure more concentrated samples?
Not reliably. The photometric range is what the instrument can display [1]; accurate quantification usually stays at moderate absorbance, where the response is linear for your sample [1][2].
12. Keep Exploring the UV-Vis Hub
- UV-Vis spectrophotometry guide: how the instrument works and what limits an absorbance reading.
- Single-beam vs double-beam spectrophotometers: drift, stability and when a reference beam matters.
- Reading a spectrophotometer spec sheet: bandwidth, stray light and photometric accuracy.
- Quartz vs glass vs plastic cuvettes: path length, cell choice and blanking.
All models: the SP-1000/1100 series, SP-UV2101, SP-UV2102, SP-UV3101, SP-UV3102, SP-XUV5101 and SP-XUV5102.