
Two identical plasma cells can behave completely differently depending on how the power supply drives them — but "how you drive it" is not a single frequency dial. A real cold-plasma supply exposes several independent electrical controls on very different timescales, and the most common mistake is to conflate them. This guide separates the carrier frequency, the burst (modulation) repetition rate, the pulse width, and the duty cycle, shows what each one physically changes, and gives a practical order in which to tune them — grounded in the actual controls of the ACS Material CTP-2000K family.
In one paragraph: the carrier is the medium-frequency AC that drives the discharge (on the CTP-2000K a center frequency near 10 kHz, adjustable over roughly 5–20 kHz). On the modulated-pulse CTP-2000K/P a much slower envelope (about 1–1000 Hz) switches that carrier on and off; the duty cycle is the on-fraction of that envelope, not a slice of one carrier cycle. The microsecond-pulse CTP-2000KM adds its own pulse width and repetition rate. Raising carrier frequency raises power and reactive-species output but also gas heating; lowering duty cycle inserts off-time that lets the gas cool; pulse shaping steers energy toward electrons rather than heat. Tuning these deliberately is how you match a discharge to a heat-sensitive process.
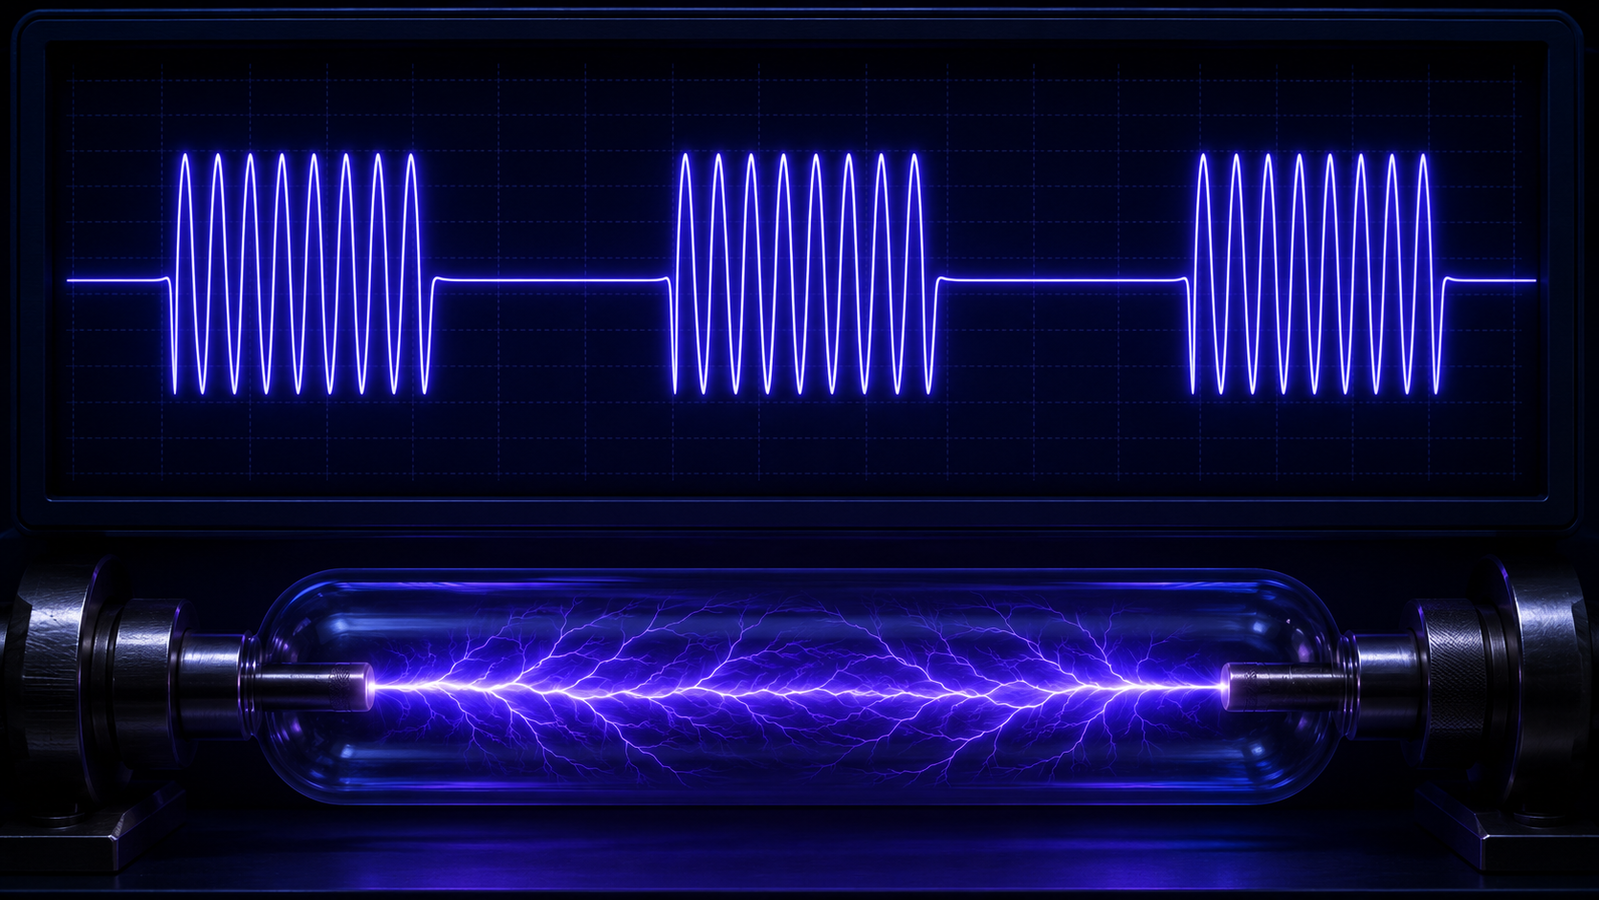
1. Four controls, not one frequency
A dielectric barrier discharge, and most cold-plasma sources, are driven by a time-varying high voltage. The discharge does not burn steadily; it fires as a rapid train of nanosecond micro-discharges whenever the applied voltage exceeds the breakdown threshold, with the dielectric quenching each one before it can heat into an arc.1,2,3 How often those micro-discharges fire, and how much energy each delivers, is set by the shape of the driving voltage — and that shape is controlled by more than one parameter.
It helps to name them explicitly, because they act on different timescales:
- Carrier (center) frequency — the medium-frequency AC that sustains the discharge, on the CTP-2000K near 10 kHz and adjustable over about 5–20 kHz.
- Burst / modulation repetition rate — a much slower on/off envelope wrapped around the carrier (on the CTP-2000K/P, roughly 1–1000 Hz).
- Pulse width — for pulsed supplies, how long each high-voltage pulse lasts (microseconds or less on the CTP-2000KM).
- Duty cycle — the fraction of time the drive is actually on, describing the burst envelope (or the pulse train), not a portion of a single carrier cycle.
These are not fully independent of the cell — the power actually delivered depends on the interaction between the driving waveform and the electrical load the reactor presents, which is itself set by geometry and dielectric.4,5 But for a given cell they are the operator's primary levers, and keeping them distinct is the whole point of this guide.
2. Carrier vs burst modulation
The single most useful thing to internalize is the difference between the fast carrier and the slow burst envelope. The simulator below lets you switch between a continuous carrier (the base CTP-2000K) and a burst-modulated carrier (the CTP-2000K/P). In burst mode, notice that each on-period contains many carrier cycles and the duty cycle describes that envelope — it does not chop an individual sine wave.6
The readouts are deliberately qualitative. The number of micro-discharge filaments, the exact power, and the gas heating all depend on the gas, voltage, geometry, and discharge mode, so the model shows trends rather than engineering values.7 With the two timescales clear, the rest of this guide takes each control in turn.
3. Carrier frequency: what it changes
The carrier frequency sets how rapidly the voltage cycles, and therefore how often the gas is driven through breakdown. A sinusoidal carrier typically fires a burst of micro-discharges around each polarity reversal, so raising the carrier frequency increases the number of discharge events per second.1 But its effects run deeper than event counting, and it is worth being precise about what physically changes:
- Capacitive impedance. A DBD is largely a capacitor; its impedance falls as frequency rises, changing how voltage and current divide between the gas gap and the dielectric.4
- Transferred charge and power. More cycles per second generally means more charge transferred and more power dissipated per unit time.8
- Memory effect. Residual charges and species from one half-cycle influence the next; at higher frequency they have less time to decay, which can ease re-ignition and shift the discharge between filamentary and more diffuse behavior.7
- Excitation opportunities and gas heating. More frequent excitation raises reactive-species production — and deposits more energy in the gas, so the gas tends to warm as frequency climbs.9
Because the last point trades against the others, carrier frequency is a balance rather than a "more is better" dial. The CTP-2000K's adjustable 5–20 kHz band (its 0.5–2× center-frequency range) exists precisely so this balance can be dialed in for a given cell and gas. When the discharge contacts a liquid — common in water treatment and biomedical processing — frequency also shapes the reactive chemistry delivered into the liquid, one more reason to tune it deliberately.10
4. Duty cycle & burst modulation: on-time and cooling
Duty cycle is the fraction of time the drive is actually on. On the modulated-pulse CTP-2000K/P this describes the slow burst envelope: the digital modulator switches the medium-frequency carrier on and off at roughly 1–1000 Hz, and the duty cycle is the on-fraction of that envelope — a completely different timescale from the carrier underneath it.9
What duty cycle changes, above all, is the time-averaged power and the off-time available for cooling. The physics rests on a separation of timescales: electrons respond to the field almost instantly and de-energize the moment it stops, but the heavy gas warms and cools slowly, over many collisions. During each off-period the electrons cool essentially at once while the gas continues to shed the heat it accumulated during the on-period.11 Chopping the drive into on/off bursts therefore lets you deliver energetic, reactive-species-rich plasma during the bursts while holding the average gas temperature down — the classic move when a process is close to working but the substrate is getting too warm.12 It is not that "electron energy never enters the gas"; it is that reducing on-time reduces the average energy deposited and gives the gas time to relax between bursts.
5. Waveform & microsecond pulses
Waveform shape is the most consequential and least obvious control. A sinusoidal voltage rises and falls smoothly; a microsecond or sub-microsecond pulse delivers a short, steep spike and then drops away. That difference in how fast the voltage changes has a large effect on where the energy goes, because the fast rise drives electrons hard for a brief instant before the energy can leak into gas heating.13,11 Dedicated pulsed supplies such as the microsecond-pulse CTP-2000KM expose their own parameters — peak voltage, rise time, pulse width, and repetition rate — along with the afterglow chemistry that unfolds between pulses.
A frequently cited result illustrates the potential. In one helium atmospheric-pressure glow-discharge jet study, a particular pulsed operating condition required about twelve times less electrical energy to produce the same atomic-oxygen output than the continuous excitation it was compared against.12 This is a striking demonstration of what pulse optimization can achieve — but it is a result for a specific device and operating point, not a universal "pulsed plasma is 12× more efficient" factor. The general principle is sound: a fast-rising pulse favors energetic electrons over bulk gas heating, and pulsed drives can sustain stable, cold discharges where a continuous sine might tip into a hot, contracted filament.14 This same control over energy delivery makes tailored waveforms valuable beyond surface work — for instance in the non-thermal plasma synthesis of nanocrystals, where the drive shapes the energetic environment the particles grow in.15 Well-characterized modern jet sources exploit exactly this pulsed, cold, reactive-species-rich regime.16,17
6. Measuring the power you deliver
Because a DBD is a capacitive load, you cannot read its power from voltage and current the way you would for a resistor — the phase relationship matters. The standard method, dating to Manley's 1943 analysis, plots the transferred charge against the applied voltage to form a closed Lissajous figure, whose enclosed area is the energy dissipated per cycle; multiply by frequency to get power.8 This charge–voltage technique remains the workhorse of DBD power measurement, and modern equivalent-circuit treatments extend it to extract further detail.18
The practical point is that the Lissajous area, not a nominal voltage setting, tells you the power you are actually delivering — and it changes as you adjust carrier frequency, duty cycle, and waveform.1 Electrical measurement pairs naturally with diagnostics that reveal where that power goes: probe methods measure the electron energy distribution, and optical emission gives the gas temperature, so a change in any control can be traced from delivered power through electron energetics to gas heating.19,20 Together they turn tuning from trial-and-error into a measured, repeatable procedure.
7. A practical tuning workflow
With the controls distinguished, a sensible order emerges. A practical starting workflow:
- 1. Set a safe gap appropriate to your reactor and dielectric.
- 2. Start at the lowest voltage that reliably ignites the discharge.
- 3. Confirm a stable discharge before changing anything else.
- 4. Adjust the carrier frequency for the power and reactive-species density you need.
- 5. Then set the burst duty cycle / repetition rate (or pulse parameters) to control average power and gas temperature.
- 6. Monitor gas and substrate temperature throughout — it depends on power density, exposure time, duty cycle, gas flow, and reactor geometry, not on any single dial.
- 7. Verify with measurement — optical emission, the Lissajous figure, or product concentration — rather than nominal settings.
The reactive species themselves — radicals and, in air or with added oxygen and water, reactive oxygen and nitrogen species — are what actually do the surface work, so tuning to maximize them at an acceptable temperature is the whole game.21,22 The same principles carry across applications: plasma catalysis and gas conversion tune carrier frequency and waveform to maximize molecular activation while keeping catalysts cool,23,24,25,26 surface modification and cold-plasma food treatment tune for reactive-species yield at safe temperatures,27,28 and plasma medicine relies on pulsed, low-temperature operation to act on tissue without thermal damage.29,30 Which control matters most depends on the goal — and often on the reactor, since the cell's capacitance sets the load the supply drives, a point developed in our DBD reactor design guide. For the larger picture of supplies and applications, see the plasma processing guide; tell us your process and substrate and we will help you dial it in.
Knowledge hub
- CTP-2000K Power Supply — the base ~10 kHz, 0–30 kV supply; continuous medium-frequency carrier.
- CTP-2000K/P Modulated-Pulse Supply — adds a 1–1000 Hz burst modulator over the carrier for duty-cycle control.
- CTP-2000KM Microsecond-Pulse Supply — sharp microsecond pulses for efficient, cool, reactive-species-rich discharges.
- Plasma Processing Guide — the pillar overview of plasma, discharges, applications, and power supplies.
- DBD Reactor Design — the reactor side of the system, whose capacitance sets the load your supply drives.
FAQ
What is the difference between carrier frequency and duty cycle in a plasma supply?
Carrier frequency is the medium-frequency AC that drives the discharge (on the CTP-2000K near 10 kHz, adjustable ~5–20 kHz). Duty cycle describes a much slower burst envelope (on the CTP-2000K/P, ~1–1000 Hz) and is the fraction of time that carrier is switched on — a different timescale, not a slice of one carrier cycle.
What carrier frequency should I run my plasma at?
It depends on the balance you need: higher carrier frequency (toward 20 kHz) tends to give more power and reactive species but warms the gas, while lower keeps things cooler. The CTP-2000K's adjustable 5–20 kHz band lets you tune this; a common approach is to set the carrier for throughput, then use duty cycle or pulse parameters to control temperature.
What does duty cycle actually do?
On a modulated supply it sets the on-fraction of the slow burst envelope, which controls the time-averaged power and the off-time available for cooling. Lowering the duty cycle inserts more off-time, during which the gas sheds heat while the electrons de-energize almost instantly — keeping the average plasma cooler.
Is pulsed excitation always more efficient than sinusoidal?
Not universally. In one helium jet study a specific pulsed condition produced the same atomic-oxygen output using about twelve times less energy than the compared continuous case — a striking illustration of pulse optimization, but a device- and condition-specific result, not a general efficiency factor. The reliable principle is that fast-rising pulses favor energetic electrons over gas heating.
How do I know the actual power my discharge is using?
Measure the charge–voltage Lissajous figure: its enclosed area is the energy dissipated per cycle, which times frequency gives power. Because a DBD is a capacitive load, this is far more reliable than inferring power from a nominal voltage setting.
Which CTP-2000K variant do I need?
The base CTP-2000K gives a continuous, adjustable carrier for most atmospheric DBD, glow, and arc work. The CTP-2000K/P adds a burst modulator (1–1000 Hz) for duty-cycle control and lower average gas temperature. The CTP-2000KM provides microsecond pulses for the most efficient, coolest, reactive-species-rich operation. The right choice depends on whether your process benefits from burst modulation or sharp pulsing.