
A UV-Vis spec sheet packs a lot into short lines: a number, a symbol, and often a small condition such as a wavelength (at 360 nm) or an absorbance band (0–0.5 A). Most buyers start with spectral bandwidth: spectrophotometer specifications give it as one figure, but like every specification it only makes sense with its condition attached. This guide explains what spectral bandwidth, wavelength accuracy, stray light and photometric accuracy each measure, what they do not tell you, and how to compare specifications that are written in different formats. It finishes with the specifications for ten ALab™ models.
Quick answer: Spectral bandwidth is the width of the band of light the instrument sends through the sample. For accurate absorbance it should be about one tenth of the width of the absorption band you measure, or less, so 2 nm is enough for most routine work [1][2]. Bandwidth is not the same as resolution. Stray light is light outside that band that still reaches the detector, and it pulls high absorbance readings low [1][4]. Photometric accuracy says how close a reading is to the true absorbance at the given level. Always read the condition next to each number.
1. How to Read a Specification
Each specification has up to three parts. The value is the number with its sign: ± is a tolerance either side, ≤ an upper limit. The condition is the wavelength, absorbance level or warm-up time at which it applies. The format is how the condition is written, as single test points or as an absorbance band. The same value under a different condition is a different specification.
For example, stray light for the SP-V1000 in the SP-1000/1100 series is specified as ≤0.2 %T at 360 nm, a single limit at a single wavelength. The SP-UV3101 has a specified photometric accuracy of ±0.0015 A (0–0.5 A) and ±0.002 A (0.5–1 A), two limits, each covering a band of absorbance. The test method behind either figure is not specified.
For stray-light specifications, ASTM E387 states that a manufacturer's value represents a new instrument tested according to the manufacturer's specification and can serve as a benchmark for future performance if the same test is repeated; it also recommends testing a new instrument promptly to establish a benchmark [9]. ASTM E275 adds the broader principle: test whether the equipment is adequate for your specific method without assuming that every performance factor has been measured [8].
2. Spectral Bandwidth on a Spectrophotometer Spec Sheet
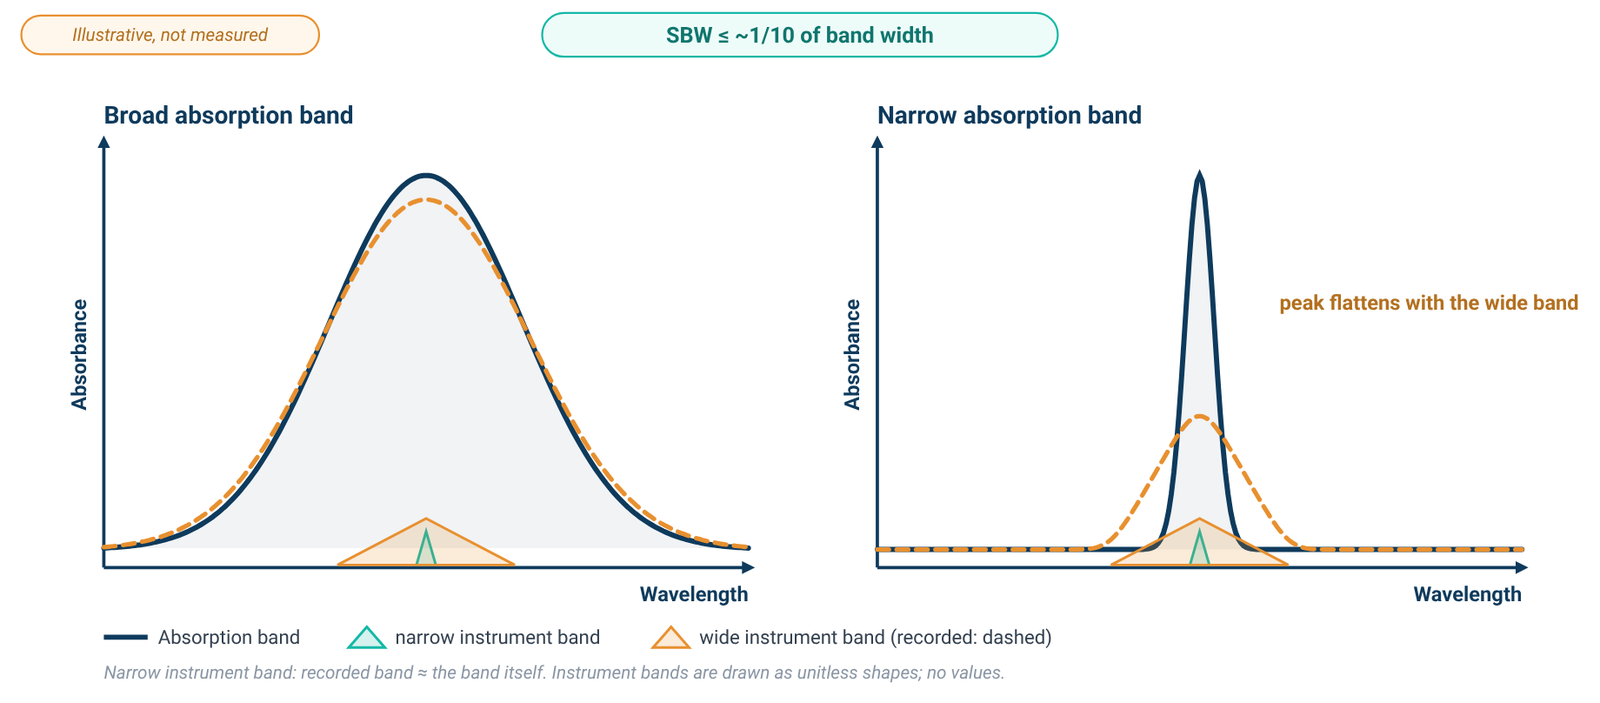
A monochromator delivers a band of wavelengths, not a single one. The width of that band at half its maximum height is the spectral bandwidth, or SBW, set mainly by the slit widths and the grating's dispersion [1][3]. The sample's absorption band has its own width, the natural bandwidth (NBW).
Their ratio decides how faithfully a peak is recorded. Owen's primer states that an SBW/NBW ratio of 0.1 or less gives absorbance accuracy of 99.5 % or better, with progressive distortion above that [1]. An open analytical chemistry textbook [4] and Agilent's current primer [2] give the same one-tenth rule.
Most samples in solution have broad bands. Owen notes that for about 99 % of routine measurements an SBW of 2 nm is more than adequate, because those bands are 20 nm wide or more [1]. Agilent's table lists natural bandwidths of 20–45 nm for chlorophyll a, adenosine and tryptophan, putting the suggested SBW at about 2–4.5 nm [2]. By the same arithmetic, a 4.0 nm bandwidth suits bands about 40 nm wide or wider.
Narrow bandwidth has a price: a narrower band improves resolution but passes less light, so the signal is noisier [1][3]. The textbook sums it up: qualitative work usually favours resolution, quantitative work usually favours low noise [3].
A smaller SBW earns its place on narrow bands. Agilent gives benzene in solution an NBW of about 2 nm, calling for an SBW near 0.2 nm [2], and wavelength standards such as holmium and didymium glass are chosen for their narrow peaks [1]. Even on narrow bands, Owen notes, calibrating with standards that bracket the sample can give accurate quantitative results [1].
ALab™ spectrophotometers come in three bandwidths: 4.0nm on the SP-V1000 and SP-UV1000, 2.0nm on the SP-V1100, SP-UV1100 and several touch-screen models, and 1.0nm on the SP-UV3101 and SP-XUV5101, among others (see the tables in Section 8).
Bandwidth is not resolution
Spectral resolution is the ability to tell two adjacent wavelengths apart; by the Rayleigh criterion, two peaks are resolved when the minimum between them falls below 80 % of the maximum [1]. It is closely related to SBW but is a separate, measured property [1]. The textbook rule of thumb, that features more than about twice the effective bandwidth apart are resolved [3], already shows the two numbers are not interchangeable.
Owen calls resolution difficult to measure and describes empirical peak-to-valley tests using narrow-band samples, including a toluene-in-hexane example [1]. No measured resolution is specified for any of the ten models, so read their bandwidth as nominal bandwidth, not as resolution.
3. Wavelength Accuracy and Repeatability
Wavelength accuracy is how close the displayed wavelength is to the true one; repeatability (precision, or resettability) is how closely the instrument returns to the same setting [1]. Accuracy matters most when results are compared across instruments, precision on a single instrument, and both matter more on the side of a band, where a small shift causes a large absorbance error [1].
These specifications come at three levels. The SP-V1000 and SP-UV1000 are specified at ±2 nm accuracy and ≤1 nm repeatability. The SP-V1100 and SP-UV1100 are specified at ±0.5 nm and ≤0.3 nm. The touch-screen models are specified at ±0.1 nm at 656.1 nm, ±0.3 nm over the full range, and ≤0.1 nm repeatability.
The two-part touch-screen figure repays a closer look. 656.1 nm is a deuterium emission line; Owen describes the deuterium lines at 486.0 nm and 656.1 nm as a common wavelength check, but warns that a check at 656.1 nm alone is not a reliable indicator of accuracy in the UV [1]. The first figure is a check at one line; the second is the one to read for the rest of the range.
Checking it yourself depends on bandwidth too. The NIST holmium oxide solution standard SRM 2034 certifies band positions at six spectral bandwidths from 0.1 nm to 3 nm; one band sits at 416.02 nm at 0.1 nm, 416.25 nm at 1 nm and 416.57 nm at 2 nm, so users compare against the value for their instrument's bandwidth [6].
Optional check filters, including holmium wavelength check filters, are listed for the touch-screen models. None are listed for the SP-1000/1100 series.
4. Stray Light
Stray light is detected light at any wavelength outside the selected band [1]. It comes from imperfections in the wavelength selector, light leaks and poor separation of wavelengths [2][4].
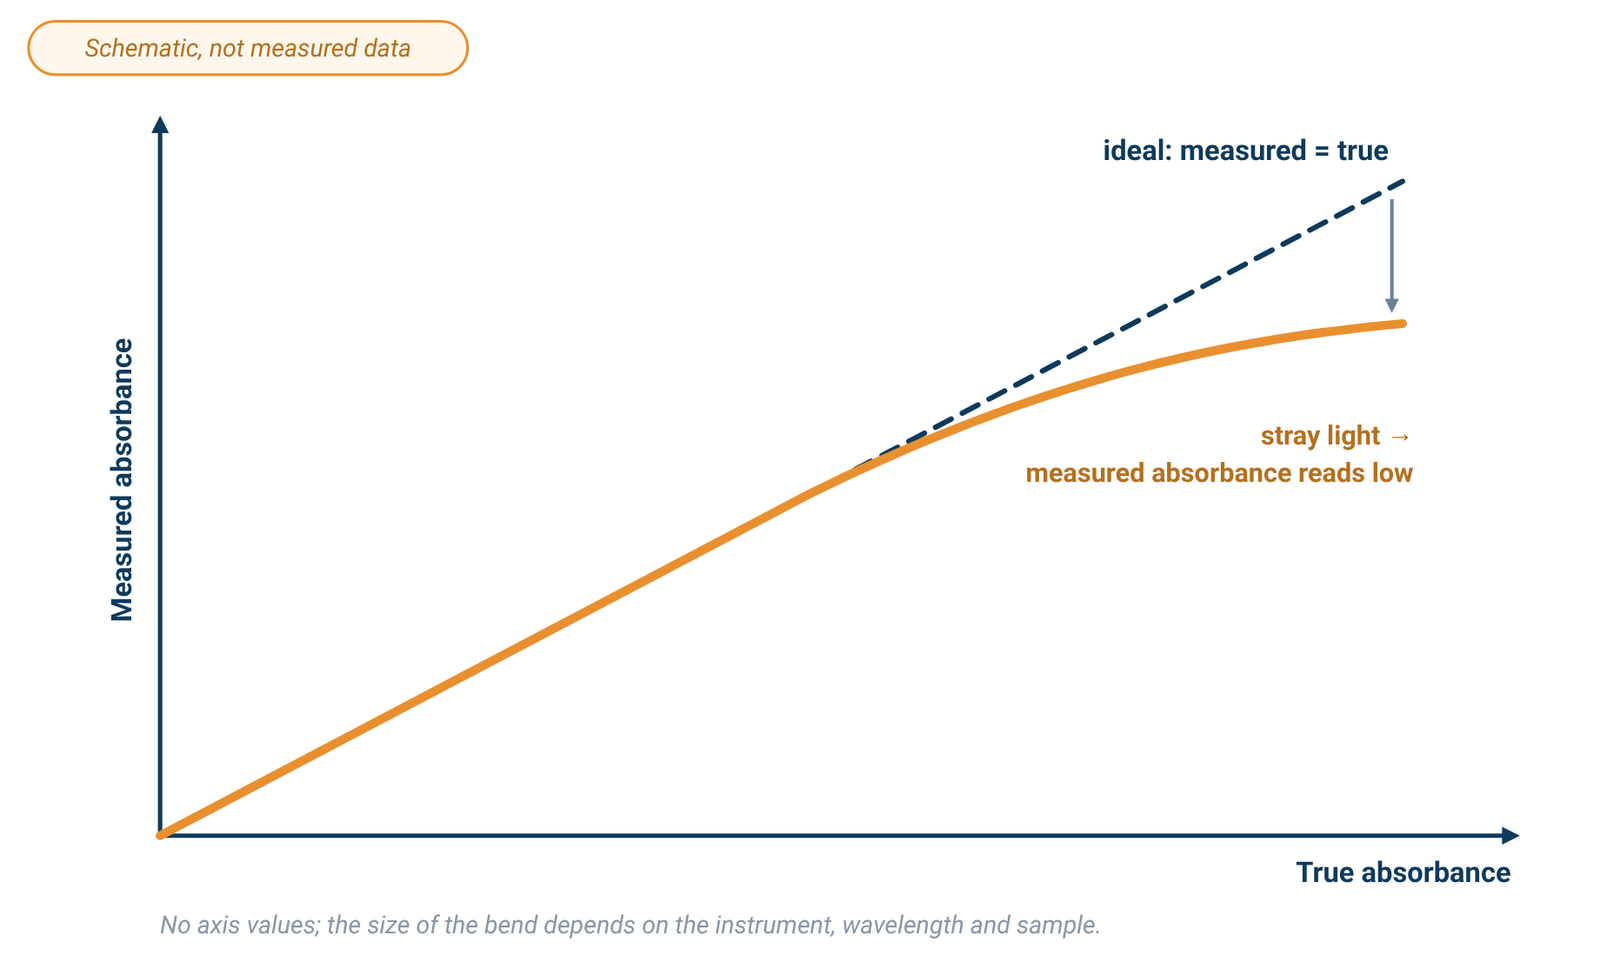
Measured transmittance becomes T = (I + Is) / (Io + Is), where Is is the stray-light intensity [1][4]. At low absorbance, Is is tiny next to I. At high absorbance, I shrinks towards Is, the reading is biased low and Beer's law bends; eventually stray light sets the highest absorbance, and so concentration, that can be measured [1][2][4].
The formula shows why the effect grows at high absorbance: as the sample transmits less light, stray light becomes a larger fraction of the detected signal and biases the reported absorbance low [1][4]. The real stray-light level at your wavelength, with your sample, is rarely known exactly.
Stray light is checked with cut-off filters or solutions that block the test wavelength [1]. It depends on wavelength and on the sample, so tests use a few representative wavelengths [1]. ASTM's opaque-filter method notes that such a test almost always underestimates the true stray-light ratio and does not provide a basis for comparing different spectrophotometers [9]. Read a stray-light figure as a benchmark at its given wavelength.
That wavelength differs between models. The SP-V1000 and SP-UV1000 are specified at ≤0.2 %T at 360 nm, and the SP-V1100 at ≤0.05 %T at 360 nm. The SP-UV1100 adds 220 nm: ≤0.05 %T at 220 and 360 nm. The touch-screen models are specified at both 220 nm and 360 nm, for example ≤0.03 %T at 220 and 360 nm for the SP-UV3102. A figure given only at 360 nm says nothing about 220 nm. The filter or solution used is not specified for any model.
Nor is stray light a beam-design property. A reference beam corrects source and electronic drift [1][2]; stray light depends on the wavelength selector and light path [2][4], and a light-tight sample compartment helps limit it [5]. Stray-light filters at 220 nm and 360 nm are optional accessories for the touch-screen models.
5. Photometric Accuracy, Repeatability and Range
Photometric accuracy is how close a reading is to the true absorbance; repeatability is how closely repeated readings agree, the difference between bias and scatter [1]. With good optical and electronic design, Owen names two factors behind both: stray light and noise [1].
Two formats are used. The SP-1000/1100 series is specified at single test points, for example ±0.002 A at 0.5 A, ±0.004 A at 1.0 A and ±0.3 %T at 100 %T for the SP-V1100 and SP-UV1100. The touch-screen models are specified over absorbance bands, for example ±0.002 A (0–0.5 A) and ±0.003 A (0.5–1 A) for the SP-UV3102. A point figure applies at that absorbance, a band figure across the band, and neither says anything above 1 A. Compare like with like.
When a single component is quantified against calibration standards, Owen notes, absolute wavelength and photometric accuracy become relatively unimportant and photometric reproducibility is essential [1]. Absolute accuracy matters when you compare with published values or across instruments.
Photometric range is not linear range
The SP-1000/1100 series has a specified photometric range of −0.3 to 3.0 A and 0–200 %T; the touch-screen models are specified at −0.3 to 3 A and 0–9999 C (0–9999 F). Owen is clear that instrument range is simply the numerical range an instrument can display; linear dynamic range is the more useful specification [1]. In his worked example combining noise and stray light, about 0.3 to 1.0 AU gives the highest accuracy and precision [1], an example for one set of conditions, not a limit for any model. When absorbance runs high, Agilent suggests diluting or a shorter path length [2].
To check photometric accuracy, Owen lists potassium dichromate solution for the UV and neutral density glass for the visible [1]. As an illustration of reference-material uncertainty, the archived 2000 NIST SRM 930e certificate reports expanded uncertainties of ±0.0023 to ±0.0024 in transmittance density, the quantity indicated on an absorbance scale, and notes that results depend on wavelength, spectral bandpass, beam geometry, stray light, temperature and filter positioning [7]. Verify over the absorbance range you actually use [1]. The touch-screen models offer a potassium dichromate (K₂Cr₂O₇) UV filter and a visible precision filter as optional accessories; a listed accessory is not a certificate of the instrument.
6. Stability, Noise and Baseline Flatness
Noise, baseline flatness and stability are typically measured at zero absorbance with a clear sample area [1], so they describe the instrument's floor, not your sample. Noise also changes with absorbance: photon noise dominates at low absorbance, electronic noise at high [1].
Each stability figure carries its own condition. The SP-1000/1100 series is specified at ≤0.002 A/h at 500 nm after two hours of preheating. The SP-UV2102, SP-UV3101 and SP-UV3102 are specified at ≤0.001 A/h at 500 nm after one hour of preheating. The SP-XUV5101 and SP-XUV5102 are specified at ≤0.001 A/h at 500 nm with no warm-up condition. Noise (0.0005 A at 500 nm) and baseline flatness (±0.001 A) are specified for the touch-screen models but not for the SP-1000/1100 series. The single-beam vs double-beam guide covers drift in more depth.
7. SP-UV3101 vs SP-UV3102: Three Specifications Differ
The SP-UV3101 and SP-UV3102 are both double-beam, touch-screen UV-Vis spectrophotometers with tungsten and deuterium lamps. Their specifications differ in three places: spectral bandwidth, stray light and photometric accuracy. Every other specification is the same.
| Specification | SP-UV3101 | SP-UV3102 | Same? |
|---|---|---|---|
| Spectral bandwidth | 1.0nm | 2.0nm | Different |
| Stray light | ≤0.02%T @ 220,360nm | ≤0.03%T @ 220,360nm | Different |
| Photometric accuracy | ±0.0015A(0–0.5A) ±0.002A(0.5A–1A) | ±0.002A(0–0.5A) ±0.003A(0.5A–1A) | Different |
| Photometric repeatability | ±0.001A(0–0.5A) ±0.0015A(0.5A–1A) | ±0.001A(0–0.5A) ±0.0015A(0.5A–1A) | Same |
| Wavelength accuracy | ±0.1nm (at 656.1nm), ±0.3nm full range | ±0.1nm (at 656.1nm), ±0.3nm full range | Same |
| Stability | ≤0.001 A/h/500nm (After 1 hour of preheating) | ≤0.001 A/h/500nm (After 1 hour of preheating) | Same |
| Noise | 0.0005A@500nm | 0.0005A@500nm | Same |
| Baseline flatness | ±0.001A | ±0.001A | Same |
| Beam (Optical System) | Double Beam | Double Beam | Same |
| Light source | Tungsten + deuterium lamps | Tungsten + deuterium lamps | Same |
| Wavelength range | 190–1100 nm | 190–1100 nm | Same |
Source: ACS Material product specifications (October 2026). The two models differ in spectral bandwidth, stray light and photometric accuracy, and share every other specification. ACS Material does not say that one difference causes another.
Each of the three specifications answers a different question:
- Spectral bandwidth matters if you measure narrow bands. For broad bands of 20 nm or more, both values meet the one-tenth rule [1][2].
- Stray light matters if you work at high absorbance, where stray light limits the reading [1]. Both models are specified at 220 nm and 360 nm.
- Photometric accuracy matters if you compare absolute absorbance values. If you quantify against your own standards, the shared repeatability figure matters more [1].
For routine quantitation of broad-band samples, the SP-UV3102's 2.0nm bandwidth meets the one-tenth rule [1][2]. The SP-UV3101 suits work where its narrower bandwidth, lower listed stray light or tighter listed accuracy matches a specific need. Compare the SP-UV3101 and SP-UV3102 specifications directly, and confirm configurations at quotation.
8. Specifications for Ten Models
The tables below give the optical and photometric specifications for all ten models. The SP-V1000 and SP-V1100 use a tungsten lamp; the SP-UV1000 and SP-UV1100 use tungsten and deuterium lamps; the SP-XUV5101 and SP-XUV5102 are double-beam instruments with a xenon lamp.
Table 1. Optical specifications
| Model | Beam | Spectral bandwidth | Stray light | Wavelength accuracy | Wavelength repeatability |
|---|---|---|---|---|---|
| SP-V1000 | Single Beam | 4.0nm | ≤0.2%T @ 360nm | ±2nm | ≤1nm |
| SP-UV1000 | Single Beam | 4.0nm | ≤0.2%T @ 360nm | ±2nm | ≤1nm |
| SP-V1100 | Single Beam | 2.0nm | ≤0.05%T @ 360nm | ±0.5nm | ≤0.3nm |
| SP-UV1100 | Single Beam | 2.0nm | ≤0.05%T @ 220 & 360nm | ±0.5nm | ≤0.3nm |
| SP-UV2101 ¹ | Single Beam | 1.0nm | ≤0.03%T @ 220,360nm | ±0.1nm (at 656.1nm), ±0.3nm full range | ≤0.1nm |
| SP-UV2102 | Single Beam | 2.0nm | ≤0.05%T @ 220,360nm | ±0.1nm (at 656.1nm), ±0.3nm full range | ≤0.1nm |
| SP-UV3101 | Double Beam | 1.0nm | ≤0.02%T @ 220,360nm | ±0.1nm (at 656.1nm), ±0.3nm full range | ≤0.1nm |
| SP-UV3102 | Double Beam | 2.0nm | ≤0.03%T @ 220,360nm | ±0.1nm (at 656.1nm), ±0.3nm full range | ≤0.1nm |
| SP-XUV5101 | Double Beam | 1.0nm | ≤0.02%T @ 220,360nm | ±0.1nm (at 656.1nm), ±0.3nm full range | ≤0.1nm |
| SP-XUV5102 | Double Beam | 2.0nm | ≤0.03%T @ 220,360nm | ±0.1nm (at 656.1nm), ±0.3nm full range | ≤0.1nm |
Table 2. Photometric specifications
| Model | Photometric accuracy | Photometric repeatability | Stability | Baseline flatness | Noise |
|---|---|---|---|---|---|
| SP-V1000 | ±0.003 A @ 0.5 A, ±0.006 A @ 1.0 A, ±0.5%T @ 100%T | ≤0.0015 A @ 0.5 A, ≤0.003 A @ 1.0 A, ≤0.25%T @ 100%T | ≤0.002 A/h @ 500 nm (after preheat 2 hours) | — | — |
| SP-UV1000 | ±0.003 A @ 0.5 A, ±0.006 A @ 1.0 A, ±0.5%T @ 100%T | ≤0.0015 A @ 0.5 A, ≤0.003 A @ 1.0 A, ≤0.25%T @ 100%T | ≤0.002 A/h @ 500 nm (after preheat 2 hours) | — | — |
| SP-V1100 | ±0.002 A @ 0.5 A, ±0.004 A @ 1.0 A, ±0.3%T @ 100%T | ≤0.001 A @ 0.5 A, ≤0.002 A @ 1.0 A, ≤0.15%T @ 100%T | ≤0.002 A/h @ 500 nm (after preheat 2 hours) | — | — |
| SP-UV1100 | ±0.002 A @ 0.5 A, ±0.004 A @ 1.0 A, ±0.3%T @ 100%T | ≤0.001 A @ 0.5 A, ≤0.002 A @ 1.0 A, ≤0.15%T @ 100%T | ≤0.002 A/h @ 500 nm (after preheat 2 hours) | — | — |
| SP-UV2101 ¹ | ±0.0015A(0–0.5A) ±0.002A(0.5A–1A) | ±0.001A(0–0.5A) ±0.0015A(0.5A–1A) | ≤0.001 A/h / 500 nm (After 1 hour of preheating) | ±0.001A | 0.0005A@500nm |
| SP-UV2102 | ±0.002A(0–0.5A) ±0.003A(0.5A–1A) | ±0.001A(0–0.5A) ±0.0015A(0.5A–1A) | ≤0.001 A/h / 500 nm (After 1 hour of preheating) | ±0.001A | 0.0005A@500nm |
| SP-UV3101 | ±0.0015A(0–0.5A) ±0.002A(0.5A–1A) | ±0.001A(0–0.5A) ±0.0015A(0.5A–1A) | ≤0.001 A/h/500nm (After 1 hour of preheating) | ±0.001A | 0.0005A@500nm |
| SP-UV3102 | ±0.002A(0–0.5A) ±0.003A(0.5A–1A) | ±0.001A(0–0.5A) ±0.0015A(0.5A–1A) | ≤0.001 A/h/500nm (After 1 hour of preheating) | ±0.001A | 0.0005A@500nm |
| SP-XUV5101 | ±0.0015A(0–0.5A) ±0.002A(0.5A–1A) | ±0.001A(0–0.5A) ±0.0015A(0.5A–1A) | ≤0.001 A/h / 500nm | ±0.001A | 0.0005A@500nm |
| SP-XUV5102 | ±0.002A(0–0.5A) ±0.003A(0.5A–1A) | ±0.001A(0–0.5A) ±0.0015A(0.5A–1A) | ≤0.001A/h / 500 nm | ±0.001A | 0.0005A@500nm |
¹ SP-UV2101: see its product specifications for wavelength range and classification.
Source: ACS Material product specifications (October 2026). SP-V1000, SP-UV1000, SP-V1100 and SP-UV1100 values are for the SP-1000/1100 series. Stray light is specified at different wavelengths for different models, and photometric accuracy is given in two formats, so compare like with like. A dash means the specification is not listed. Confirm specifications at quotation.
Three things stand out. First, the stray-light wavelength changes between models, so a figure given only at 360 nm cannot be compared with one given at 220 nm. Second, photometric accuracy is given as test points for the SP-1000/1100 series and as absorbance bands for the touch-screen models. Third, on the SP-UV3101/SP-UV3102 and SP-XUV5101/SP-XUV5102 pairs, the 1.0 nm model also has lower stray light and tighter photometric accuracy than its 2.0 nm sibling. These are separate specifications, and ACS Material does not link them.
9. Spec-Sheet Checklist
- Read the condition with every value: wavelength, absorbance level or band, and warm-up time.
- Compare spectral bandwidth with the natural bandwidth of your bands; about one tenth or less [1][2].
- Treat bandwidth as nominal; look for a separately specified resolution if peak separation matters [1].
- For UV work, read the full-range wavelength accuracy, not only the single-line figure [1].
- Check stray light at a wavelength close to yours, and expect it to matter most at high absorbance [1].
- Compare photometric accuracy only in the same format and at the same absorbance.
- Do not read photometric range as linear range [1].
- For stray-light benchmarking, ASTM E387 recommends testing a new instrument promptly and using the manufacturer's specified test for critical comparison with the manufacturer's specification [9].
10. Frequently Asked Questions
Is a 1.0 nm bandwidth always better than 2.0 nm?
No. A narrower band improves resolution but gives a noisier signal [1][3]. For bands 20 nm or wider, 2 nm already meets the one-tenth rule [1][2].
Is spectral bandwidth the same as resolution?
No. Bandwidth is the width of the light band leaving the monochromator; resolution is the measured ability to separate two adjacent features [1]. They are related, but a bandwidth figure is not a resolution figure [1][3].
Does a double-beam design reduce stray light?
Not by itself. The reference beam corrects source and electronic drift [1][2]. Stray light comes from the wavelength selector and the light path [2][4], so read it as its own specification.
Does a photometric range of −0.3 to 3 A mean readings are linear up to 3 A?
No. Range is what the instrument can display; linear dynamic range depends on stray light, noise and the sample [1]. Owen's example puts the highest accuracy and precision at about 0.3–1.0 AU [1].
What does ±0.1 nm at 656.1 nm, ±0.3 nm full range mean?
The tighter figure applies at 656.1 nm, a deuterium emission line used for wavelength checks; the full-range figure covers the rest. A check at 656.1 nm alone is not a reliable indicator of UV accuracy [1].
11. Keep Exploring the UV-Vis Hub
- UV-Vis spectrophotometry guide: how the instrument works and what limits an absorbance reading.
- How to choose a UV-Vis spectrophotometer: wavelength range, beam design and light source across all models.
- Single-beam vs double-beam spectrophotometers: drift, stability and when a reference beam matters.
- Beer–Lambert law: the formula behind absorbance and concentration.
- Quartz vs glass vs plastic cuvettes: cell choice, path length and blanking.
The pair compared here: SP-UV3101 and SP-UV3102.