A powder pattern taken at room temperature is a portrait: sharp, accurate, and completely still. But most of what materials scientists actually care about — a battery charging, a catalyst lighting off, a ceramic sintering, an alloy ordering — happens while the temperature moves. In-situ X-ray diffraction is the technique that keeps the camera rolling: it records the diffraction pattern continuously while a sample is heated, cooled, or held under a reactive gas, turning a single portrait into a film of the crystal structure evolving in real time. This guide builds the method from Bragg’s law up — how three features of every diffraction peak encode structure, what turning the temperature knob does to them, the non-ambient hardware that makes it possible, and the applications where watching beats looking afterward.
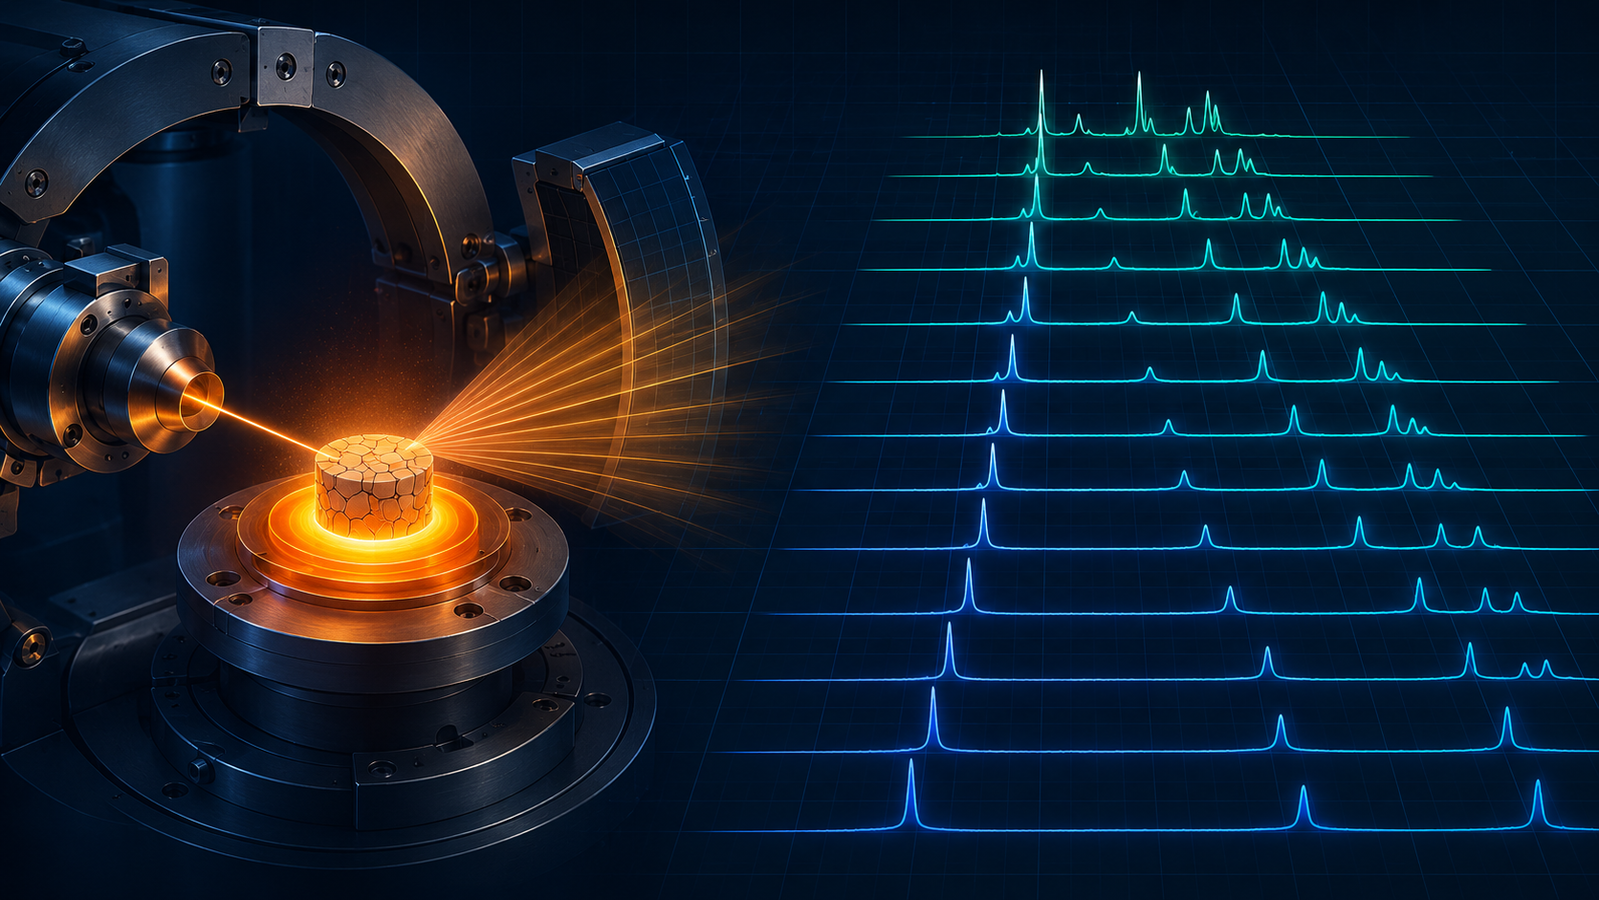
What in-situ XRD reveals: a diffraction peak offers three complementary signals — its position fixes the lattice spacing, its width reflects crystallite size and microstrain once the instrument’s own broadening is accounted for, and its integrated intensity tracks the phases present. Heat a sample under the beam and all three move: peaks slide as the lattice expands (or, in rare materials, contracts), split or vanish as phases transform, and rise or fall as one phase consumes another. Reading that motion quantitatively is the job of sequential and parametric Rietveld refinement. The enabling hardware is a non-ambient stage — a heater or cryostat with an X-ray-transparent window and a fast area detector — and the payoff is direct: phase-transition temperatures, reaction pathways, thermal-expansion coefficients, and degradation mechanisms measured on the material while it works, not reconstructed from quenched fragments afterward.
1. The problem with still pictures
X-ray diffraction is the definitive tool for crystal structure. When W. H. and W. L. Bragg showed in 1913 that a crystal reflects X-rays only at angles where scattering from successive atomic planes adds in phase — the relation nλ = 2d sin θ that still bears their name — they turned the diffraction pattern into a ruler for the atomic lattice.1 A century of refinement has made powder XRD a routine, quantitative method: given a pattern, one can extract the phases present, their lattice parameters, and their crystallite sizes with confidence.2
The catch is that the standard measurement is static. Mount a powder, scan it at room temperature, and you learn what the material is — at that temperature, in that state, after whatever history brought it to the sample holder. But the questions that matter in materials development are almost all about change: at what temperature does this phase transform, how does that catalyst restructure when it starts working, what intermediate appears between reactant and product, why does this electrode fade after a hundred cycles? The classical workaround is ex situ — interrupt the process, quench the sample, and measure the frozen state. It is often the only option, but it has a well-known hazard: quenching can change what it was meant to capture, letting a metastable phase relax or a transient intermediate vanish before it reaches the diffractometer. You measure the wreckage, then argue backward to the event.
In-situ diffraction removes the interruption. The sample sits in an environment — hot, cold, or gas-filled — that the diffractometer can see into, and patterns are recorded continuously as conditions change. The metastable phase is caught while it exists; the reaction intermediate is caught mid-reaction; the transition temperature is read directly off the pattern where the peaks change. The rest of this guide is about how that works, and what it takes.
2. The variable-temperature lab
The simulator below is a stripped-down variable-temperature diffractometer. It shows a slice of a powder pattern — a few peaks on a 2θ axis — and a temperature slider. Drag the temperature up and watch the peaks migrate to lower angle as the lattice expands; push past the transition and watch a high-temperature phase grow in as the low-temperature peaks fade. Switch the material model to see the rarer case where the lattice shrinks on heating. The readout shows the fractional lattice change and an illustrative high-temperature-phase fraction, driven by the same simplified model that draws the peaks. Play with it first; the sections that follow explain each behavior.
3. What a peak encodes: position, width, intensity
To read the film, you have to know what each frame says. A diffraction peak provides three principal, complementary observables — position, profile width, and integrated intensity. They are not fully independent, but together they constrain the lattice spacing, the microstructure, and the phase evolution, and in-situ work is largely the art of watching all three at once.
Position → lattice spacing. Bragg’s law ties a peak’s angle directly to the interplanar spacing d: shift the peak, and you have measured a change in the lattice.1 This is the most-used channel in variable-temperature work, because thermal expansion shifts every peak in a way that gives the unit-cell dimensions as a continuous function of temperature.
Width → size and strain. An ideal infinite crystal gives infinitely sharp peaks; real peaks are broadened by finite crystallite size, by microstrain — and, in any real measurement, by the instrument itself. The sample-related broadening grows as crystallites shrink, so once the instrumental profile has been measured or modelled, line-profile analysis can separate the size and strain contributions when the pattern offers enough peaks and adequate counting statistics — which is how processes like grain growth on annealing or the refinement of a nanostructured phase are followed.2
Intensity → phase evolution. The integrated intensities of a phase’s peaks grow and shrink with the amount of that phase present: when one phase transforms into another, the first set of peaks fades while the second rises, and following those intensities through time is how reaction progress is watched. But a peak height, or a simple intensity ratio, is not by itself a phase fraction — intensities also carry structure factors, absorption, preferred orientation, and the measurement geometry. Reliable quantification therefore uses whole-pattern Rietveld refinement, which fits a complete calculated pattern to the complete measured one — accounting for those effects while extracting lattice parameters, phase fractions, and sizes all at once.2 Modern open-source packages such as GSAS-II make this the standard analysis path for the hundreds of patterns an in-situ run produces.3
4. Turning the temperature knob
Heat is the most common in-situ variable, and it drives three distinct kinds of peak motion — each a different piece of physics.
Expansion: the peaks slide. Almost everything expands on heating: bonds lengthen, the lattice grows, d increases, and by Bragg’s law every peak marches to lower 2θ. Tracking that march gives the thermal-expansion coefficient directly, and doing it by fitting one evolving structural model across the whole temperature series — parametric Rietveld refinement — is both more precise and more physically honest than fitting each temperature independently, because it can even refine the temperature itself as a variable.4 The classic demonstration is ZrP2O7, whose expansion and 567 K phase transition were mapped exactly this way.4
The exception that proves the rule: negative thermal expansion. A few remarkable materials do the opposite. Zirconium tungstate, ZrW2O8, contracts continuously as it is heated — isotropically, from 0.3 K all the way to its decomposition near 1050 K — a result established by diffraction across that entire range.5 In the simulator, the negative-expansion model sends the peaks the “wrong” way, to higher angle, on heating. These materials matter because blending them with normal ones yields composites engineered to near-zero expansion, and in-situ diffraction is how their behavior is characterized in the first place.5
Transformation: peaks split, appear, disappear. When a material changes phase, the diffraction pattern rewrites itself — a cubic phase lowering symmetry splits single peaks into pairs, a new phase nucleating grows a fresh set of peaks, a decomposing phase erases its own. The temperature at which this happens is read directly off the pattern, and because in-situ collection is continuous, transient intermediate phases that a quench would miss are caught in the act.6 Following the intensities through the transformation gives not just the transition temperature but the reaction pathway — which phase becomes which, and through what, as demonstrated in classic studies of zeolite and molecular-sieve crystallization tracked by time-resolved diffraction.7 Extracting clean kinetics from those hundreds of evolving patterns increasingly leans on multivariate and whole-series analysis methods built for exactly this data.8
5. Non-ambient hardware: getting the beam to a hot sample
The physics is straightforward; the engineering is where in-situ diffraction lives or dies. The instrument has to hold a sample at a controlled, uniform, accurately known temperature and let the X-ray beam reach it and the diffracted beam escape — simultaneously.
The stage. A non-ambient attachment is a heater or cryostat with a well-characterized thermal path to the sample. Purpose-built laboratory furnaces reach well over 1000°C with fine control and good temperature homogeneity, which is what makes the extracted lattice parameters trustworthy.9 The most demanding designs combine wide temperature range with extra stimuli — controlled gas atmosphere, or even an applied electric field — in a single chamber; one such synchrotron chamber spans 100 K to 1250 K while allowing electrical contact to the sample.10 For transmission-geometry work under reactive gases at temperature, capillary-based flow cells and domed environmental chambers keep the sample in a defined atmosphere while the beam passes through.11 At the extreme, focused-lamp and laser radiation furnaces push accessible temperatures higher still for specialized synchrotron microscopies.12 In the InSitu Pro™ line these roles are filled by the AXCH600 / AXCH400V XRD heating-and-cooling stages for laboratory diffractometers, the AXH1200 ultra-high-temperature XRD stage for the hottest regimes, and — for beamline work — the AIH1600-SR synchrotron IR furnace.
The window. Something has to contain the hot zone or the vacuum while staying nearly invisible to X-rays. That job falls to low-atomic-number window materials — polymer films like polyimide (Kapton), or beryllium and graphite domes — chosen because they transmit hard X-rays with minimal absorption and add little of their own scattering to the pattern.13 Window and geometry choices are a study in themselves, and they set real limits on what a given stage can measure; a companion article in this cluster treats 2θ access and window materials in detail.
6. Time and flux: the laboratory–synchrotron spectrum
In-situ diffraction is a race against the process: the pattern has to be collected faster than the sample changes. That makes X-ray flux and detector speed the defining variables, and they place experiments on a spectrum.
The idea is old — the first “dynamic” diffraction experiments followed an electrode discharging in real time as early as 1978, using nothing more exotic than a laboratory source and clever timing.14 What transformed the field was the detector. Fast photon-counting area detectors capture a whole arc of the diffraction pattern in a single fast exposure instead of scanning one angle at a time, collapsing acquisition from minutes toward seconds and below and making genuine time-resolved sequences routine.15 The distinction worth keeping is that a detector’s millisecond-scale readout is not the same as the exposure a usable pattern needs: that depends on source flux, how strongly the sample scatters, the geometry and any absorbing windows, and the counting statistics the analysis demands. On a modern laboratory diffractometer with an area detector, a pattern good enough for phase and lattice tracking on a favorable sample can be taken in seconds — ample for a slow anneal or a gradual transition — while weak scatterers or high-precision refinements ask for longer.
When the process is fast, or the sample weakly scattering, or fine time and spatial resolution are needed, synchrotron radiation supplies orders of magnitude more flux, driving sub-second and spatially resolved diffraction that laboratory sources cannot reach.16 The tradeoff is access, not capability: laboratory in-situ XRD is the everyday workhorse for temperatures, transitions, and reactions on human timescales, and the synchrotron is where you go when the clock — or the signal — demands it.
7. Four fields, one method
The reason in-situ diffraction is worth the engineering is the breadth of what it answers. Four fields show the range.
Batteries. An electrode’s crystal structure changes as it charges, and operando XRD — diffraction on a working cell — follows it live. In a graphite anode the staging sequence of lithium intercalation appears as peaks marching through a defined series of positions with state of charge, tying structural change to electrochemical behavior; the same approach, spatially resolved, maps how charge distributes unevenly across a real pouch-cell electrode.17,18 Purpose-built hardware puts a working cell in the beam: the ABE in-situ XRD battery cell and the AXCH100-PB / AXCH100-BB battery XRD stages are designed for exactly this operando geometry.
Catalysis. A catalyst’s active phase often exists only under working conditions — the right temperature, the right gas. In-situ XRD in a controlled atmosphere follows the real phase evolution through activation, reaction, and deactivation, which is exactly the information catalyst design needs and ex-situ study cannot safely supply.19 Purpose-built reaction cells make this a standard characterization, whether for bulk catalysts or thin films under reactive gas.20
Frameworks and gas storage. Porous crystals such as metal–organic frameworks flex, breathe, and rearrange as guest molecules enter and leave. Single-crystal and powder diffraction performed while gases are dosed in captures how the framework responds — the crystallographic basis of designing materials for gas capture and separation.21 Done in situ with reactive or biologically relevant gases, it reveals binding sites and structural responses directly.22
Reaction and synthesis mechanisms. Beyond these, in-situ diffraction is how researchers watch solid-state reactions and syntheses proceed — even mechanochemical reactions inside a shaking mill can now be followed by synchrotron diffraction, exposing intermediates no quench could preserve.23 The unifying breadth of X-ray scattering across all of electrochemistry and electrocatalysis, from single crystals to full devices, is the subject of comprehensive review.24
8. Choosing a stage for your diffractometer
Turning this method into a measurement on your own instrument comes down to matching a non-ambient stage to the science. A few questions settle most of the choice. What temperature range? A transition at 300°C and a decomposition at 1400°C need different heaters; cryogenic transitions need a cryostat, not a furnace. What atmosphere? Inert, oxidizing, reducing, or reactive gas each dictates chamber and window materials — oxidation studies need controlled O2, air-sensitive samples need sealed inert environments. Which geometry? Reflection (Bragg–Brentano) and transmission (capillary) stages suit different sample forms and beam paths, and the window material has to pass the beam at your energy without swamping the pattern.11
ACS Material’s InSitu Pro™ line of heating, cooling, and probing stages is built around exactly these variables — controlling the sample environment while preserving the incident and diffracted beam paths. For diffraction, the anchor of the family is the dedicated AXCH600 / AXCH400V XRD stage. Because controller and sample temperatures can differ, quantitative lattice and phase work should validate the sample temperature under the actual stage geometry, sample loading, ramp rate, and atmosphere. The theory guide linked below lays out the full family and how the stimuli combine; the Stage Selection Guide walks the five-step decision framework, and the interactive InSitu Pro™ Stage Selector filters the whole range by application, temperature, cooling method, chamber, and probes — or the ACS Material team can advise on the right configuration for a specific diffractometer and temperature program.
Knowledge hub
- In-Situ Heating, Cooling & Electrical Stages: A Theory Guide — the pillar theory guide for the whole in-situ stage family and the physics behind it.
- XRD Stage AXCH600 / AXCH400V — the dedicated heating-and-cooling XRD stages for laboratory diffractometers.
- InSitu Pro™ Stage Selection Guide — the five-step decision framework for matching a stage to your instrument, temperature range, and atmosphere.
- InSitu Pro™ Stage Selector — interactively filter the whole range by application, temperature, cooling method, chamber, and probes.
- InSitu Pro™ Heating & Cooling Stages — browse the full product family, including the XRD stage line.
FAQ
What is the difference between in-situ and operando XRD?
In-situ means the diffraction is measured while the sample is under a non-ambient condition — heated, cooled, or in a controlled atmosphere. Operando is a stricter subset: the sample is measured while actually functioning as intended, and its performance is monitored at the same time. A battery electrode diffracted while being charged, with the current and voltage recorded alongside, is operando; the same electrode heated on a stage just to study a phase change is in-situ.
What temperature range can in-situ XRD stages reach?
The full span runs from cryogenic — well below −150°C with liquid-nitrogen or closed-cycle cooling — to over 1400°C with dedicated high-temperature furnaces. No single stage covers all of it; the range you need dictates whether you use a cryostat, a moderate-temperature heater, or a high-temperature furnace, and the window and chamber materials that go with each.
Can I do in-situ XRD on a laboratory diffractometer, or do I need a synchrotron?
A great deal of in-situ work is done on laboratory instruments. With a modern photon-counting area detector, a laboratory diffractometer can track thermal expansion, phase transitions, and reactions that proceed over seconds to hours — the majority of thermal studies. You reach for a synchrotron when the process is fast (sub-second), the sample scatters weakly, or you need fine spatial resolution — situations where its far higher flux is essential.
How fast can in-situ diffraction patterns be collected?
It depends on flux, the sample, and the counting statistics the analysis needs. Under favorable conditions, a laboratory instrument with an area detector collects a usable pattern for phase and lattice tracking in seconds; weak scatterers or high-precision refinements need longer exposures. At a synchrotron, sub-second and even millisecond patterns are achievable when beamline, detector, sample, and geometry permit — which is what makes fast transitions and true kinetics accessible. The guiding rule is unchanged: the pattern must be collected faster than the sample changes.
What does peak broadening tell me during heating?
Peak width reports crystallite size and microstrain on top of the instrument’s own broadening. During heating, peaks often narrow as crystallites grow (annealing and grain growth), and can broaden where strain develops or a phase becomes disordered. Because size and strain affect the width differently, careful analysis — after correcting for instrumental broadening — separates the two — letting you follow grain growth and strain evolution alongside the lattice and phase changes read from position and intensity.
Does the sample need special preparation for a variable-temperature run?
Generally the sample must make good thermal contact with the stage and sit correctly in the beam, and its form has to match the geometry — a flat packed powder bed in reflection and a packed capillary in transmission are the common examples, though preparation ultimately depends on the instrument, the stage, the sample form, the atmosphere, and the question being asked. Thermal expansion can move the sample surface during a run, so some stages compensate the height to keep the diffracting volume in the beam, while others call for alignment checks or temperature-dependent height correction. Atmosphere-sensitive samples need appropriate sealed or flowing-gas loading.
References
This article is provided by ACS Material LLC for educational purposes and describes in-situ X-ray diffraction and the non-ambient stages used to perform it. Quantitative values cited — transition temperatures, thermal-expansion behavior, temperature ranges, and acquisition times — refer to specific materials, idealized models, or the particular instruments and conditions of the referenced studies; the behavior of any real sample, and the specifications of a given stage, depend on the material, the model and options selected, the sample mounting, the atmosphere, and the measurement setup. The temperature a sample experiences can differ from the controller setpoint, and sample temperature should be validated under the actual experimental conditions. Consult product datasheets and specifications for the exact capabilities of each stage. The interactive simulator is a schematic teaching tool — peak positions follow an idealized linear thermal-expansion model with a single illustrative phase transition, and the displayed phase fraction is the model’s input parameter, not a quantity extracted from the plotted intensities — not predictive software; real measurements must be calibrated experimentally for each material and system.