-
XRD-Raman Classification of Commercial Graphene - West Virginia University, 2017
Jun 04, 2026 | ACS MATERIAL LLCSeehra, M. S. et al. (2017). Correlation between X-Ray diffraction and Raman spectra of 16 commercial graphene–based materials and their resulting classification. *Carbon*. https://doi.org/10.1016/j.carbon.2016.10.010
Carbon · 2017
Researchers correlated XRD and Raman spectra of 16 commercial graphene-based materials, including five from ACS Material, into three structural groups.
About this research
Researchers at West Virginia University and the National Institute for Occupational Safety and Health (NIOSH) used X-ray diffraction and Raman spectroscopy to characterize 16 commercial graphene-based materials, five of which were supplied by ACS Material, and reported that the ACS Material graphene nanoplates (2–10 nm) gave the lowest defect concentration of the entire sample set, with an I(D)/I(G) ratio of 0.22 corresponding to roughly 12.6 ppm Raman-active defects. The paper, published in Carbon (2017) by Seehra, Narang, Geddam and Stefaniak, builds a quantitative correlation between XRD signatures and Raman D, G, D′, 2D and (D+D′) band features and uses that correlation to sort commercial samples into three structural groups.
Commercial graphene, graphene oxide (GO) and reduced graphene oxide (rGO) are now sold by many suppliers, and their structural quality varies widely. This matters not only for fundamental device studies — where stacking order, layer thickness and defect density govern electronic behavior — but also for occupational toxicology, because graphite nanoplates and few-layer graphene have distinct biological profiles. The authors note that supplier labels ("single layer graphene", "graphene oxide", "reduced graphene oxide") do not always reflect the underlying structure. A simple, reproducible XRD-plus-Raman protocol that bins materials into well-defined classes therefore helps both materials scientists buying samples and regulators assessing exposure risk.
Five ACS Material products entered the study as samples under investigation: graphene nanoplates (2–10 nm), graphene oxide, carboxyl graphene, single-layer graphene (nitrogen-doped), and single-layer graphene. XRD measurements were taken on a Rigaku D-Max diffractometer with CuKα radiation (λ = 0.154185 nm) in step-scan mode (0.01° steps, 6 s per step) over 2θ = 1°–75°. Raman spectra were collected on a Renishaw inVia microscope at 532 nm with a 5× objective, 100% laser power (11.6 mW), 10 s exposure and 15 accumulations from 1000–3500 cm⁻¹. Spectra were fitted to Lorentzians in WiRE 3.4 and cross-checked in OriginLab 9.0. The Cancado/Bruna calibration was applied to convert I(D)/I(G) into defect density nD, normalized against the ideal graphene atom density nC = 3.82 × 10¹⁵ cm⁻² to give defect concentrations in ppm.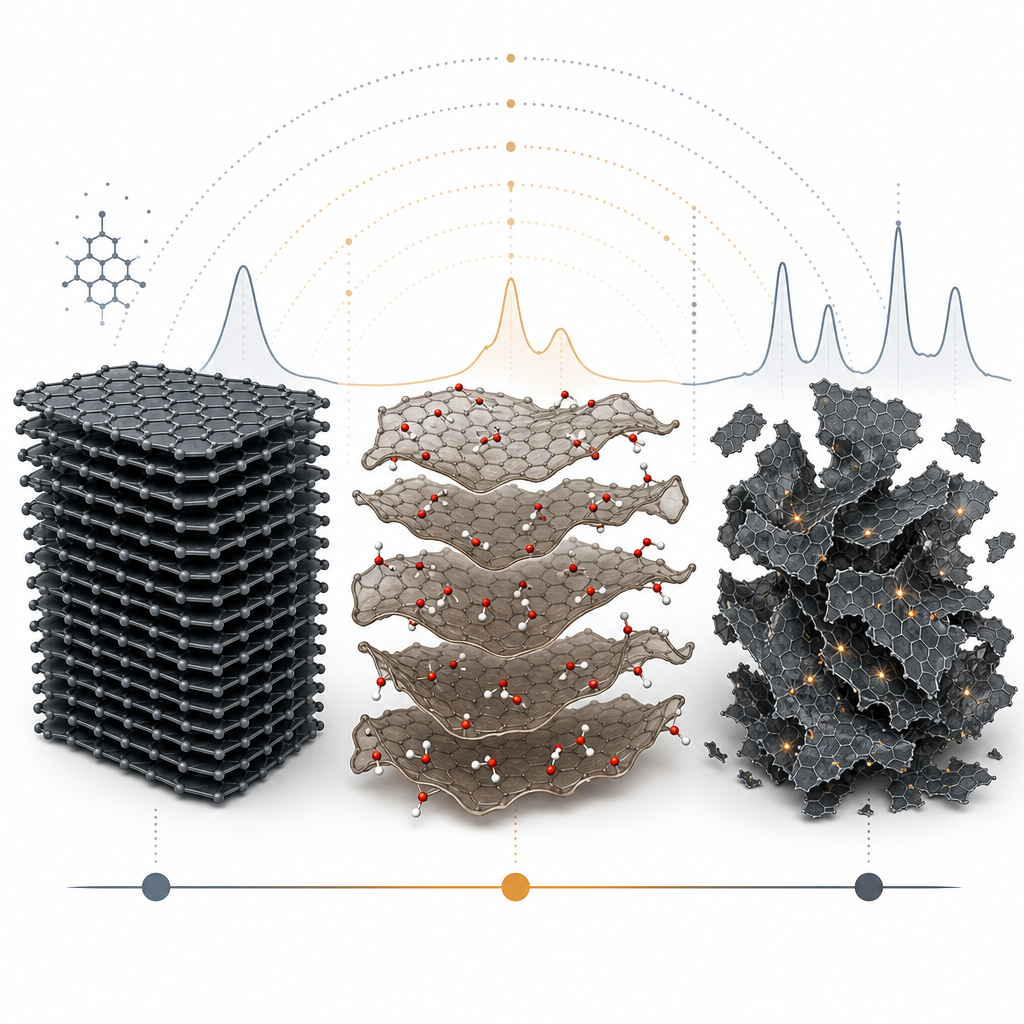
The ACS Material graphene nanoplates (sample 1) fell cleanly into Group A: a graphitic nanosheet stack roughly 20 nm thick exhibiting both 2H (ABA) and 3R (ABCA) phases in XRD, with the characteristic four Bragg peaks between 2θ = 45° and 47°. Its I(D)/I(G) of 0.22 was the lowest of all 16 samples, translating to nD ≈ 4.80 × 10¹⁰ cm⁻² or ~12.6 ppm — the cleanest material in the study. The ACS Material graphene oxide (sample 2) and carboxyl graphene (sample 3) both produced the expected GO XRD signature: a sharp peak near 2θ ≈ 10° corresponding to an expanded interlayer spacing d ≈ 0.9 nm (versus 0.335 nm for graphite), confirming intercalated oxygen functional groups. Their I(D)/I(G) values were 1.46 and 1.50 respectively, with Raman D-band FWHM in the 100–150 cm⁻¹ range (Group B). The ACS Material nitrogen-doped single-layer graphene (sample 4) and single-layer graphene (sample 5) were classified as Group C disordered carbons, showing extremely weak 2θ ≈ 24° XRD features, broad D bands (180–210 cm⁻¹ FWHM), and the highest defect ratios (1.92 and 1.96). Across the full set, defect density increased systematically from Group A through B to C, and the G-band position shifted from ~1584 cm⁻¹ to ~1595 cm⁻¹ — placing every sample within Stage 1 of the Ferrari–Robertson amorphization model.
The practical takeaway is a vendor-independent classification protocol. Researchers buying commercial graphene for energy-storage electrodes, composite fillers, biosensor inks, or transparent conductors can use the XRD/Raman fingerprints reported here to verify whether a powder marketed as "single-layer graphene" is actually a few-layer graphitic nanoplate, a true GO, or a disordered carbon — categories that perform very differently in batteries, supercapacitors, and biomedical assays. The protocol is also directly relevant to inhalation toxicology programs at NIOSH, where structural class predicts pulmonary response. Follow-on work suggested by the authors includes lower-angle SAXS to extract fractal pore dimensions and Raman fitting strategies that resolve overlapping char-like sub-bands in the most disordered samples.
For researchers, the study underlines that consistent material specifications are essential and that ACS Material supplies the full spectrum of graphene products — graphene nanoplates, graphene oxide, carboxyl graphene, nitrogen-doped graphene, and single-layer graphene — each of which appeared in this independent third-party benchmark. The graphene nanoplates in particular gave the cleanest graphitic signature of all 16 samples tested. Groups looking to reproduce or extend this XRD/Raman classification work can source comparable, well-characterized graphene-family powders from ACS Material's catalog under the Graphene Series and CVD Graphene categories.How ACS Material products were used
- Carboxyl Graphene (-COOH) (Graphene Series) — “Carboxyl graphene ACSM B(1) GO 1.50 (Sample 3)”
- Graphene Oxide (ACS Material) (Graphene Series) — “Graphene oxide ACSM B(1) GO 1.46 (Sample 2)”
- Graphene nanoplates (2-10 nm) (Graphene Series) — “Graphene nanoplates (2–10 nm) ACSM A GR 0.22 (Sample 1)”
- Nitrogen-doped Graphene Powder (single layer) (Graphene Series) — “Single layer graphene (nitrogen doped) ACSM C DC 1.92 (Sample 4)”
- Single Layer Graphene (Graphene Series) — “Single layer graphene ACSM C DC 1.96 (Sample 5)”
Product Performance in this StudyClassified into Group A as graphitic nanosheets. Exhibited the lowest defect density of all 16 samples studied, with I(D)/I(G) = 0.22 corresponding to ~12.6 ppm Raman-active defects, indicating high structural order.
Related product categories
Frequently asked questionsHow is the I(D)/I(G) ratio used to quantify defects in commercial graphene?
The intensity ratio of the Raman D and G bands scales with the density of Raman-active defects nD via the Cancado-Bruna relation at 532 nm excitation. Dividing nD by the ideal graphene atom density nC = 3.82 × 10¹⁵ cm⁻² gives a defect concentration in parts per million. In this study, I(D)/I(G) = 0.22 in the ACS Material graphene nanoplates corresponded to roughly 12.6 ppm defects, the lowest in the sample set.
What XRD feature distinguishes true graphene oxide from disordered carbon?
True graphene oxide shows a sharp XRD peak near 2θ ≈ 10°, corresponding to an interlayer spacing of about 0.9 nm caused by oxygen functional groups intercalated between layers. Disordered carbons instead show very weak, broad scattering near 2θ ≈ 24° with no clear (100) or (101) reflections. This signature cleanly separated ACS Material's graphene oxide and carboxyl graphene from samples marketed as 'single-layer graphene' that turned out to be disordered carbons.
Why are 2H and 3R phases important in graphene nanoplates?
Bulk graphite normally adopts the 2H (ABA) stacking, but commercial graphene nanoplates frequently contain a substantial 3R (ABCA) fraction. The 3R phase is a semiconductor with a tunable band gap, whereas 2H graphene multilayers behave as semimetals. Detecting both phases in XRD, typically around a 60/40 ratio, therefore signals graphitic nanosheet character roughly 20 nm thick and informs the electronic behavior of the material in devices.