
A DSC trace tells you that something melted at 151 °C. It does not tell you whether the crystal slumped quietly into a puddle, threw off a burst of gas as a solvate broke, cracked into a new polymorph and re-melted, or grew a forest of needles on the way back down. Hot-stage microscopy answers the question a thermogram cannot: what did it actually look like? Put a heating-and-cooling stage under a microscope, watch the sample through crossed polarizers as the temperature sweeps, and melting, crystallization, desolvation, and solid–solid transformations stop being peaks on a chart and become events you can see — onset, morphology, sequence, and all. This guide covers what you can watch, the polarized-light optics that make it visible, how to read melting and crystallization correctly, and what a hot stage has to deliver to earn its place on the microscope.
1. Hot-Stage Microscopy vs DSC: Why Watch the Transition?
Differential scanning calorimetry (DSC) is the default tool for thermal transitions, and it is superb at what it does: it measures heat flow, so it tells you how much energy a transition absorbs or releases and at what temperature. What it cannot do is show you the sample. A single endothermic peak might be a clean melt, or it might hide overlapping events — a polymorphic conversion followed immediately by melting, a desolvation whose gas loss coincides with a phase change, or a melt that instantly recrystallizes into a higher-melting form. Hot-stage microscopy is the complementary technique that supplies the missing spatial picture, and the two are so often used together that combined DSC-plus-thermomicroscopy studies are a standard approach for resolving exactly these ambiguities2.
The complementarity is the whole point. HSM detects small changes that a thermogram can miss — a subtle change in birefringence, the first optically resolvable droplet of a melt, a crack propagating through a crystal — and it disambiguates events that DSC records only as a single, featureless peak1. In pharmaceutical practice the technique earned its place precisely because a microscopist can see a polymorphic transformation happen, rather than inferring it from an enthalpy value3. It is also a routine partner to DSC in excipient-compatibility screening, where visual confirmation of an interaction settles what calorimetry alone leaves uncertain4. The modern instrument, with digital image capture synchronized to the temperature program, records the whole event as a movie with a temperature stamp on every frame — evidence, not just a number3. The method has a long metrological pedigree as a thermal-analysis discipline in its own right5.
| Feature | Hot-stage microscopy | DSC |
|---|---|---|
| Primary signal | Optical morphology and texture | Heat flow |
| Spatial information | Yes — you see where events happen | No; bulk-averaged |
| Transition enthalpy | No | Yes |
| Melting onset | Visually observed | Thermally measured |
| Polymorph conversion | Reveals morphology and sequence | Reveals the thermal event |
| Crystallization growth rate | Directly measurable for resolved fronts | Inferred from bulk kinetics |
| Best use | Seeing what happens and where | Measuring energetic transitions |
| Main limitation | Optical resolution and interpretation | No direct morphology |
The two techniques are complementary rather than interchangeable. Structural identity normally requires XRD, Raman, or another phase-specific method.
2. What You Can See on Heating and Cooling
The catalogue of observable events is what makes the technique so versatile. Sweep the temperature and, depending on the material, you may watch any of the following unfold directly under the objective1:
- Melting and the melting range. The first liquid appears at the melt onset; the last crystal disappears at the clear point. Between them lies the melting range — itself a purity indicator, since impurities depress and broaden it. The same visual access lets HSM resolve individual drug particles inside a formulated tablet by watching it disintegrate on heating6.
- Crystallization and nucleation. On cooling a melt, you see where crystals first nucleate, how many nuclei appear, and how fast the growth fronts advance — the raw material of crystallization kinetics.
- Solid–solid polymorphic transitions. One crystal form converts to another, sometimes with a visible change in birefringence colour, cracking, or a moving transformation front — often with no change in shape to warn you.
- Desolvation and dehydration. A solvate or hydrate loses its guest molecules, frequently with visible bubbling, clouding, or a texture change as the lattice collapses — which makes HSM a standard partner to calorimetry and diffraction in characterizing hydrates and solvates7.
- Decomposition. Darkening, gas evolution, or charring marks the onset of thermal degradation — and tells you the upper temperature bound of any useful measurement.
- Liquid-crystalline phase sequences. Between crystal and isotropic liquid, mesophases appear as characteristic textures that change as each transition is crossed.
Crucially, many of these events are invisible without polarized light or would register on a thermogram as nothing more than a small, ambiguous blip. The ability to assign a face, a colour, and a morphology to each thermal event is what turns a temperature into a mechanism.
3. Polarized-Light Hot-Stage Microscopy & Birefringence
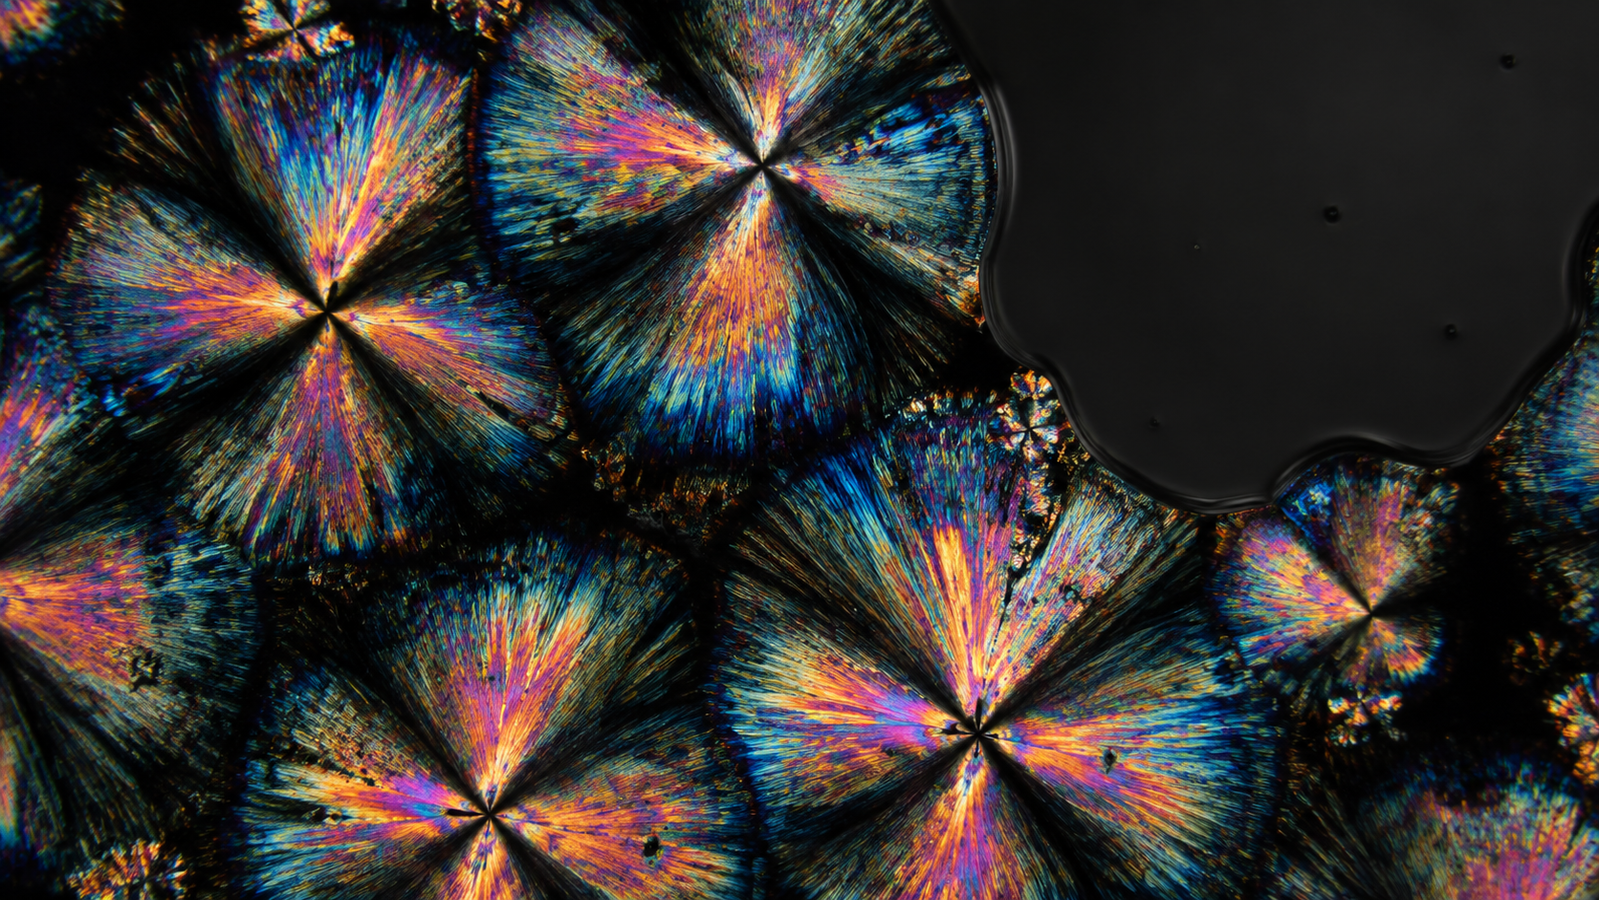
The single optical trick that powers most of hot-stage microscopy is the crossed-polarizer setup. Place one polarizer below the sample and a second one — the analyzer — above it, rotated 90° so that, with nothing between them, no light gets through and the field is black. Now introduce the sample. Many non-cubic crystalline materials are optically anisotropic and therefore birefringent: they resolve incoming polarized light into two components that travel at different speeds and recombine, with a phase difference, into light that can pass the analyzer. The crystal lights up against the dark field, often in vivid interference colours. Cubic crystals and truly isotropic materials — an unstressed isotropic liquid, a homogeneous glass — generally leave the light unchanged and stay dark between crossed polarizers, unless stress, flow orientation, texture, or other optical effects introduce additional contrast.
That single contrast mechanism does an enormous amount of work. Melting becomes visible: for a birefringent crystal that melts directly into an isotropic liquid, the loss of birefringence provides a clear visual marker of melting — though a material that passes through a liquid-crystalline or otherwise anisotropic intermediate phase may retain polarized-light contrast after the original crystal has disappeared. Polymorphic changes become observable: a form change may produce shifts in interference colour, extinction behaviour, cracking, or domain texture — valuable evidence of a transformation, though not a unique structural fingerprint, because the optical appearance also depends on crystal thickness, orientation, stress, and morphology. And the interference colour itself is quantitative — it depends on the sample's birefringence and thickness in a way captured by the Michel-Lévy chart, whose modern, first-principles recalculation sharpened the colour-to-retardation mapping that underlies optical crystallography8. Rotating the stage makes anisotropic crystals blink bright and dark every 90° (going “extinct” when their optical axes align with the polarizers), while a truly isotropic phase stays dark at every angle — a simple, definitive test.
The most beautiful expression of all this is the spherulite: when many materials crystallize from a melt, they grow radiating, roughly spherical aggregates of fibrous crystals that, under crossed polarizers, display a dark “Maltese cross” aligned with the polarizer directions. Spherulites are the signature morphology of melt crystallization in polymers and many small molecules, and the classic phenomenological theory explains why a flat growth front becomes unstable and breaks into the branching fibrils that build them9, while modern phase-field modelling reproduces the full range of spherulitic growth forms from first principles10. Their size and growth rate are not just pretty — they are data, as the next section lets you explore.
4. Interactive: Spherulite Growth vs. Undercooling
The simulator below is an idealized model of one of hot-stage microscopy's most important measurements: how fast a spherulite grows as a function of undercooling — how far below the melting point you hold the melt. Drag the temperature and watch two things happen at once: the growth rate of the spherulite changes, and so does the number of nuclei that appear. The interplay between those two is what sets the final microstructure you would see down the microscope.
The physics is real, even though the numbers are illustrative. Crystal growth from a melt is a contest between two temperature-dependent effects. Close to the melting point the thermodynamic driving force is tiny, so growth is slow. Far below it, the driving force is large but the melt is viscous and molecular motion is sluggish, so growth is slow again for a different reason. In between sits a maximum — the growth rate G traces a bell-shaped curve against temperature, qualitatively consistent with the bell-shaped growth-rate behaviour predicted by secondary-nucleation models, and careful spherulitic-growth-rate measurements on isotactic polypropylene mapped exactly this dependence while pinning down its equilibrium melting temperature11. Undercooling also controls nucleation density: within a practical crystallization window, deeper undercooling means more nuclei and a finer-grained solid of small spherulites, while shallow undercooling means few nuclei and a coarse structure of large ones. At very deep undercooling, however, molecular mobility can become so limited that both nucleation and growth are suppressed. The overall transformed fraction — the sigmoidal way it climbs with time — is often fitted with an Avrami-type model of nucleation-and-growth kinetics when its assumptions are approximately met12, whose companion papers generalized the treatment to real granular microstructures13. Hot-stage microscopy is the instrument that lets you measure G and the nucleation density directly, by watching.
5. How to Measure Melting Point & Range by Hot-Stage Microscopy
Determining a melting point is the oldest use of the hot stage, and the most deceptively simple. A pure crystalline substance melts over a narrow range; the onset (first liquid) and the clear point (last crystal) should be close together. For many well-behaved small-molecule crystalline substances, impurities depress the observed onset and broaden the melting range, so the melting range serves as a rough purity check — but polymorphism, solvation, decomposition, particle size, and sample confinement can produce similar effects, so it is best treated as a screening indicator rather than a stand-alone purity measurement. But three experimental realities decide whether your number means anything.
First, heating rate matters. Push the temperature up too quickly and the sample lags the stage — the reading runs high, and sharp events smear. Slow, controlled ramps near the transition are the price of an accurate onset, which is why a programmable stage with true segment control, not just a maximum rate, is worth having. Second, calibration matters. The temperature you trust is only as good as the standards you calibrated against; certified reference materials with well-established transition temperatures — and, for cooling experiments, standards chosen to cope with the supercooling that first-order transitions show on the way down — are what tie your stage to a real temperature scale14. Third, the melt can lie. A great deal of hot-stage work is really about what happens after the first melt: some substances melt, then immediately recrystallize into a more stable, higher-melting form, so that a single sample shows two melting events in sequence. Seeing that recrystallization happen — rather than mistaking the second melt for the true one — is exactly the disambiguation the microscope provides and the thermogram cannot.
6. Polymer Crystallization, Spherulite Growth & Avrami Kinetics
Turn the experiment around — cool a melt instead of heating a solid — and hot-stage microscopy becomes a crystallization laboratory. Because you can watch nucleation and growth directly, it is well suited to the two quantities that govern how a material solidifies: the apparent nucleation density (the number density of optically resolved nucleation sites) and the growth rate (how fast each front expands). Measuring the radius of a spherulite against time gives the linear growth rate G of the resolved front directly, and repeating that across temperatures maps out the bell-shaped G(T) curve that anchors nucleation theory11. The structure that results — and the boundaries where impurities pile up between impinging spherulites — is the domain of the phenomenological theory of spherulitic growth9, and the growth of spherulites is the microscopic foundation on which the calorimetric (DSC) analysis of solidification ultimately rests15.
Two cautions keep this quantitative rather than merely descriptive. The first concerns the equilibrium melting temperature that all undercooling calculations depend on: it is not simply the highest melting point you observe but a thermodynamic quantity that must be extrapolated, and the original Hoffman–Weeks extrapolation16 — and its later linear versus non-linear refinements — give measurably different answers depending on the method chosen17. The second concerns the kinetics themselves: fitting the classic Avrami model to real data is riddled with avoidable pitfalls — baseline choice, the conversion range used, the cooling history — and doing it correctly requires following explicit guidelines rather than turning a handle18. For the broadest overview of where the various overall-kinetics theories succeed and fail, the critical assessments of the field are the place to start19. Hot-stage microscopy supplies the direct, visual measurements — the growth rate of resolved crystal fronts and the apparent number density of optically resolved nucleation sites — that keep those models honest, and it does so with a spatial resolution that a single bulk-averaged calorimetry signal simply cannot match.
7. Polymorphs, Pharmaceuticals & Cocrystals
Nowhere has hot-stage microscopy paid off more than in the study of polymorphism — the ability of one compound to crystallize in more than one structure. For a drug, the polymorph decides solubility, dissolution rate, stability, and ultimately bioavailability, so identifying and controlling the form is a regulatory necessity, not an academic nicety. The foundational review that established polymorphism as a central pharmaceutical concern already placed thermal microscopy among its essential characterization tools20, and the technique remains a first-line method for detecting the small solid-state changes — conversions, desolvations, metastable-form appearances — that other methods miss1.
What HSM reveals is the thermodynamic relationship between forms. Whether two polymorphs are enantiotropic (each stable in its own temperature range, with a reversible transition between them) or monotropic (one always metastable, converting irreversibly) determines how they behave on heating — and the heat-of-transition and heat-of-fusion rules that classify them are the everyday framework for interpreting what the microscope shows21. The textbook example is carbamazepine: its four anhydrous polymorphs were comprehensively distinguished by combined diffraction, calorimetry, and thermomicroscopy, establishing a stability order among the forms that HSM helps read directly22. The technique extends naturally to cocrystals — two components co-crystallized in one lattice — where polarized-light thermomicroscopy combined with DSC is a standard screening route, as the ketoprofen–nicotinamide system illustrates2. And when polymorphic identity has to be confirmed on the exact same stage, hot-stage microscopy pairs seamlessly with vibrational spectroscopy: variable-temperature Raman turns each thermal event into a fingerprinted structure, as studies tracking the recrystallization of amorphous paracetamol through its forms make clear23 — the subject of our companion guide to variable-temperature Raman spectroscopy.
8. Liquid Crystals & Soft Matter
Beyond simple melting lies a richer world that hot-stage microscopy was practically made for: materials that pass through one or more intermediate mesophases between crystalline solid and isotropic liquid. Liquid crystals are the archetype, and polarized optical microscopy on a hot stage is the primary tool for identifying their phases, because each mesophase — nematic, the various smectics, cholesteric, and the exotic bent-core phases — displays a characteristic optical texture. The nematic phase shows its famous schlieren texture of dark brushes meeting at point defects; smectic phases show fan-shaped or focal-conic textures — a visual catalogue spanning nematic, cholesteric, smectic and bent-core phases24; and as the temperature crosses each transition, one texture transforms visibly into the next25.
The important caveat is that texture identification is an expert skill, not an automatic readout. Textures provide strong evidence and reveal transition temperatures when the appearance changes, but they are most reliable when combined with complementary methods — DSC to catch the transition enthalpies, X-ray diffraction to pin down the structure — rather than relied upon alone25. Used that way, on a well-controlled stage, hot-stage polarized microscopy maps a soft material's entire phase sequence in a single temperature sweep, which is why it remains indispensable across liquid crystals, block copolymers, lipids, and other self-assembling systems.
9. How to Choose a Hot-Stage Heating & Cooling Stage
Five controls for a reliable hot-stage microscopy experiment
A hot stage is a small thermal machine that has to satisfy a microscope, and the compromise defines the specification. The essentials are quickly stated. Temperature range and control come first: a genuinely useful stage reaches from well below ambient to several hundred degrees, and — more importantly — offers not just a maximum ramp rate but fixed-point, ramp, and fully programmed multi-segment profiles, because accurate melting and crystallization work lives or dies on controlled rates near the transition. Temperature stability and uniformity across the small viewed area decide whether your measured onset means anything. Controlled cooling is non-negotiable for crystallization: you cannot study solidification, undercooling, or spherulite growth without the ability to cool in a controlled way — liquid-nitrogen cooling is the usual route to genuine sub-ambient reach, though it also raises the risk of condensation or frost on cold surfaces, which a dry-gas purge, a vacuum chamber, or window-defogging design is used to counter.
Then come the optics, because a hot stage lives or dies by optical access. The sample sits beneath a window that must transmit the light and, for polarized work, preserve its polarization state; the working distance of the objective must clear that window and its frame, which is why long-working-distance objectives are the standard companions. A reflection or transmission light path broadens what you can study, and a controlled atmosphere — an inert gas purge, or the ability to evacuate — matters whenever the sample oxidizes or a low-temperature run risks condensation on the windows. Sample preparation, too, is part of the instrument's reach: a thin, laterally uniform specimen improves optical clarity and reduces thermal lag, and slide-and-cover-glass preparation works well for many melting and liquid-crystal experiments — but confinement can alter nucleation, crystal growth, vapour transport, desolvation, and decomposition, so sample geometry should be chosen for the process being studied. Poor thermal contact is a common source of error. For an idealized-glass or inorganic sample, the same stage that watches an organic crystal melt can equally follow softening, sintering, and the characteristic-temperature sequence of a powder compact on heating26. Choosing well means matching the stage's temperature range, cooling capability, optical geometry, and atmosphere control to the specific transitions you intend to watch.
The InSitu Pro™ Optical Heating and Cooling Stage ACH600S / ACH400SV is built for exactly the melting, crystallization, and polymorph work in this guide. Both bodies pair liquid-nitrogen cooling with resistive heating at ±0.1 °C stability, ramp at up to 150 °C min−1 heating and 40 °C min−1 cooling — controlled cooling for genuine crystallization studies — and run fixed-point, ramp, or fully programmed segment profiles from the supplied software. The optics suit polarized thermomicroscopy: reflection or transmission geometry, a manually removable φ25 × 1 mm quartz window, and just 4.5 mm from window to sample surface on the standard 24 mm-high body. For especially tight optical geometries — the clearance under a Raman objective or condenser — the ultra-thin ACH600S-T / ACH400SV-T variants drop the body height to 21.5 mm (2.5 mm lower) with identical temperature performance, purpose-built for compact instruments such as Horiba Raman systems.
- ACH600S — −190 to 600 °C, atmosphere chamber: the broad-range workhorse for melting, crystallization, and polymorph studies in a controlled ambient atmosphere.
- ACH400SV — −190 to 400 °C, vacuum chamber: the same optical-stage format for air-sensitive samples and vacuum-compatible sub-ambient work with controlled window defogging.
Around them sits the full InSitu Pro™ heating & cooling range — optical, electrical, mechanical, and special-application stages — matched to experiments in the stage selection guide. Not sure which body fits your microscope and temperature program? The InSitu Pro™ Stage Selector walks you from five questions to a one-click quote.
10. Frequently Asked Questions
11. Keep Exploring the InSitu Pro™ Knowledge Hub
Hot-stage microscopy is the optical member of a larger family of in-situ techniques that watch materials change under real conditions. These guides connect the view down the microscope to the rest of the toolkit:
- In-situ heating, cooling & electrical stages: a theory guide — the shared physics of sample temperature, thermal lag, and controlled environments that underlies every stage-based method.
- Variable-temperature Raman spectroscopy: a practical guide — the vibrational-spectroscopy partner that fingerprints each phase HSM reveals, on the same kind of optical stage.
- In-situ XRD: watching crystal structure evolve — when you need the crystal structure and phase fractions behind a transition, not just its morphology.
- InSitu Pro™ Optical Heating & Cooling Stage (ACH600S / ACH400SV) — the product page for the optical-application stage that carries the microscopy experiments in this guide.
- InSitu Pro™ stage selection guide — matching stage geometry, temperature range, and atmosphere to the transition you intend to study.