
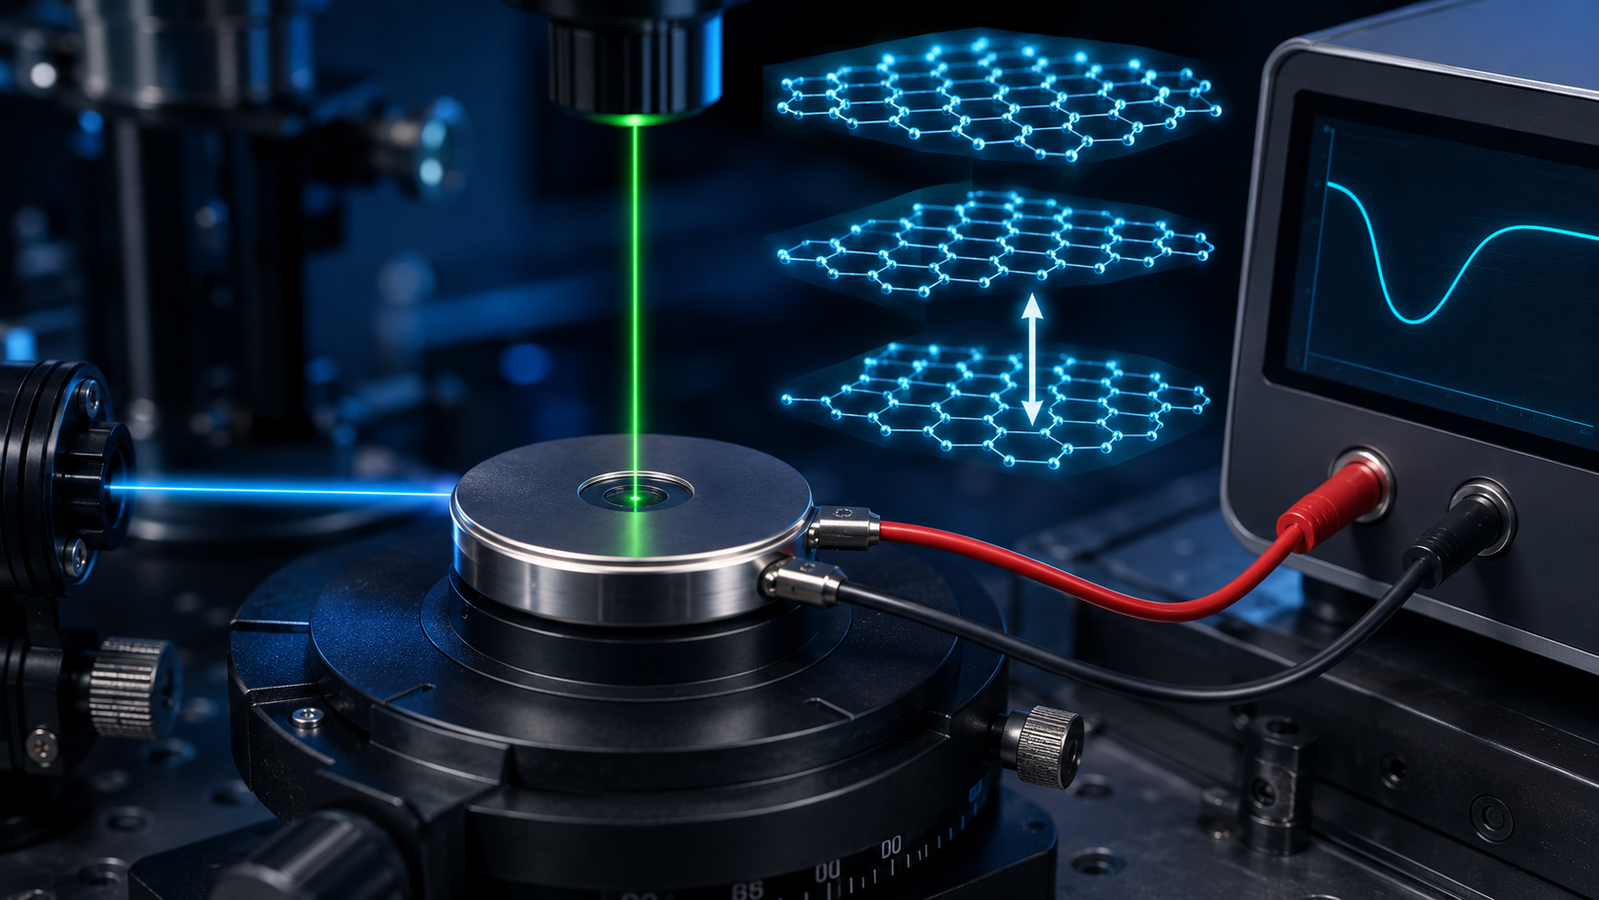
A battery is materials science compressed into a can: crystallography (electrodes that change structure with every electron), spectroscopy (bonds that stretch and break on schedule), electrochemistry (the current that pays for it all) and thermal physics (performance that lives and dies by temperature) — all coupled, all at once1. That coupling is exactly why post-mortem analysis keeps disappointing battery researchers, and why the field marched earlier and harder than any other toward in-situ and operando measurement. This article is the battery chapter of the InSitu Pro™ knowledge hub: what X-ray diffraction, Raman spectroscopy and temperature-controlled electrochemistry each see inside a working cell, why the cell you can measure is never quite the cell you sell, and how the three channels together turn a voltage curve into a structural story.
1. Why Batteries Demand In-Situ Measurement
Disassembling a battery to study it changes the battery. The moment the case opens, electrodes meet air and moisture, delicate interphases evolve, volatile electrolyte leaves, and metastable phases — the very states that carry the interesting electrochemistry — relax toward whatever survives on a lab bench. Worse, a battery’s structural state is a function of its state of charge: the cathode chemistry that made lithium-ion practical is a story of frameworks that reversibly host and release lithium, their lattices shifting with every increment of charge2, and the anode’s graphite runs its own staged program in parallel. A post-mortem sees one frame of the film, blurred by the autopsy. The perspective pieces that survey the field’s history make the same point from the systems side: the battery’s behavior emerges from coupled processes — intercalation, interphase growth, transport — that only coexist in an operating cell3. In-situ and operando measurement is not a luxury refinement here: it is the direct access to transient working states that relax, react or disappear during disassembly — while post-mortem, cryogenic and quasi-operando methods remain valuable complements for higher-resolution chemical and structural analysis of what survives.
2. What XRD Sees: Lattices That Breathe with Charge
Diffraction’s gift to battery science is that intercalation is a crystallographic event. As lithium enters graphite, the interlayer spacing dilates and the stacking reorganizes through a sequence of staged compounds — a progression that operando diffraction reads directly from peak positions and intensities during cycling, making the graphite negative electrode the canonical structural readout of state of charge4. Cathodes tell their own diffraction stories: solid-solution materials shift peaks smoothly with lithium content, while two-phase materials grow one phase’s reflections at the expense of another’s — two mechanistically different worlds distinguished at a glance in the pattern, and mapped across electrode chemistries by the operando diffraction literature5. One boundary keeps this honest: peak growth and decay are strong evidence of phase evolution, but a peak-height or simple intensity ratio is not by itself a quantitative phase fraction — intensities also carry structure factors, preferred orientation, absorption and microabsorption, electrode texture and cell-window geometry, so reliable quantification uses whole-pattern analysis with those corrections in place. The lineage is worth knowing: dynamic X-ray diffraction of an electrode during electrochemical cycling was demonstrated in 1978 — a battery experiment was the founding act of the entire operando diffraction tradition6 — and today’s energy-materials beamline programs are its direct descendants, tuned for non-equilibrium states that only exist mid-cycle7. The in-situ XRD guide carries the general diffraction methodology; the battery cell adds the design problem of Section 6.
3. What Raman Sees: Bonds Reporting from the Electrode
Raman spectroscopy is diffraction’s complement inside a cell: local, surface-weighted, and fluent in exactly the materials batteries are made of. Graphite’s G and D bands track both the quality of the carbon and — through characteristic changes on lithium uptake — the electrode’s charge state from the bond side; transition-metal-oxide cathodes carry phase-specific vibrational fingerprints that shift and transform as lithium moves; and the comprehensive review of Raman microspectrometry applied to lithium-battery electrode materials is the standard map of which spectral features report which structural events across the major chemistries8. Raman’s micrometer spot is both its power and its caveat: it interrogates a place, which makes it the tool of choice for heterogeneity — particle-to-particle state-of-charge differences invisible to any averaging probe — and simultaneously the tool most obliged to prove its spot is representative. The methodology — window materials, laser-power discipline, temperature dependence of the spectra themselves — is the variable-temperature Raman guide’s territory, applied here through a cell window with the laser-heating caution turned up: an electrode is an absorbing target, and the probe can locally cook what it measures.
4. Electrochemistry Meets Temperature: The Third Channel
The potentiostat’s record — voltage, capacity, impedance — is itself a probe, and temperature is its sharpest lens. Many of the major processes in a cell — ionic transport, charge transfer, solid-state diffusion, interphase growth, parasitic reactions — are strongly temperature-dependent, so capacity and impedance are strong functions of temperature; cold operation slows kinetics and, at the extreme, invites hazardous side reactions on the anode, while heat accelerates both performance and degradation chemistry — the central operating tension the battery-systems literature returns to again and again1. Temperature-resolved electrochemistry — the same cycling protocol repeated across a controlled temperature series — therefore separates mechanisms the way a rate sweep separates them in the tensile world: temperature-dependent measurements can support extraction of an apparent activation scale where the dominant mechanism and fitting model have been justified over the interval, and the transition from kinetics-limited to transport-limited behaviour moves visibly with T. The measurement infrastructure is this hub’s home ground: a temperature-controlled platform with electrical feedthroughs, the discipline of the electrical probe stage guide (stable contacts, verified rather than assumed), and the stage-versus-sample temperature honesty of every article here — a cycling cell generates its own heat, so the small-sample self-heating logic applies with the current turned up9.
5. Interactive: The Cell Breathing Lab
The simulator below puts Sections 2–4 on one axis. Slide the state of charge of a schematic graphite half-cell and watch two synchronized read-outs: the cell voltage walking down its curve, and the graphite interlayer spacing dilating as lithium fills the galleries — the electrochemical step and its lattice echo, together.
The teaching point is the article’s thesis in one control: many electrochemical steps have a structural echo — though some interfacial, amorphous, minority-phase or locally confined processes stay invisible to any particular probe. The voltage the potentiostat reports and the lattice parameter the diffractometer reports are two languages describing one lithium inventory — which is exactly why operando measurement, reading both on one clock, out-argues either alone. The model is deliberately schematic: a smooth illustrative voltage curve and a monotonic interlayer-dilation curve stand in for graphite’s genuinely staged, plateau-structured behaviour (the real staircase is the subject of the operando diffraction literature4), values are teaching quantities, and no real electrode’s curve should be read off this widget.
6. The Cell-Design Problem: The Measurable Cell vs the Real Cell
Here is the field’s honest tension: a commercial cell is opaque, sealed and optimized for energy; a measurable cell needs a window (X-ray-transparent, or optically clear for Raman), a beam path that is not all casing, and often thinner electrodes or modified stacks. Every concession buys signal and spends representativeness — window materials contribute diffraction background and confine the electrode differently than a production casing; modified geometry changes pressure, wetting and current distribution; and the operando-methods literature devotes sustained attention to cell designs that minimize exactly these distortions while keeping electrochemistry honest10. The discipline that follows: before interpreting the structural data, compare the measurement cell against a reference cell using predefined acceptance criteria — capacity, Coulombic efficiency, polarization, rate response, impedance, cycle stability, electrode loading, stack pressure and repeatability — and report the cell design as part of the result — because “graphite stages at these potentials in this cell” is the claim the data actually support. Beamline programs institutionalized this validation culture early7; laboratory operando work inherits it.
7. The Temperature Axis: The Stage’s Contribution
Temperature enters battery research three ways, and a controlled stage serves all three. As an operating variable: performance mapping across the application envelope, cold-start behaviour, high-temperature endurance — the temperature series of Section 4. As an acceleration tool: degradation studies run hot to compress calendar time, with the standard caveat that acceleration is only valid where the mechanism does not change with temperature. And as a measurement condition to be controlled: a cycling cell self-heats, ambient drifts, and every temperature-sensitive observable (Raman shifts, lattice parameters, impedance) needs the sample’s actual temperature, not the room’s — the calibration-chain discipline that anchors every claim in this hub11, plus specimen-adjacent sensing to catch the self-heating a setpoint cannot see9. The stage’s job description in battery service is therefore double: hold the environment steady enough that temperature is a controlled variable, and make the cell’s own thermal behaviour measurable rather than invisible.
8. The Error Budget: Battery Edition
Beam and laser effects first: X-ray dose can drive chemistry in sensitive electrolytes and charged electrodes, and the Raman laser is a local heater aimed at an absorbing electrode — power series and on/off comparisons are the price of believing either channel10. Cell-design terms next: window background under the diffraction pattern, modified-geometry electrochemistry, and the representativeness gap of Section 6 — systematic, and only bounded by validation against standard cells. Cross-channel interference: cycling currents can couple into sensitive measurements, and the probes perturb each other exactly as the correlative chapter warns. Temperature terms throughout: self-heating during high-rate steps, gradients across a windowed cell, and the sensor-versus-sample offsets this hub’s pillar article dissects — all live inside every “at 25 °C” claim11. The general counsel is the operando literature’s refrain: engineer the cell and the synchronization first; the prettiest simultaneous dataset cannot repair an unrepresentative cell.
9. Hardware Notes: Building the Battery Bench
The battery bench is a composition of this hub’s instruments around one temperature-controlled core, and the InSitu Pro™ stage family includes catalogued battery platforms whose fit follows the experiment — each described here only by the capabilities its published datasheet states, with mounting, cell format and any further configuration confirmed at quotation:
| Experiment goal | Platform | Published capability |
|---|---|---|
| XRD during charge–discharge cycling | In-Situ XRD Battery Cell (ABE) | Beryllium window, reflection geometry, 2θ 10–180°; no temperature-control parameters specified |
| Variable-temperature pouch-cell / electrochemical-cell XRD | Battery XRD Stage (AXCH100-PB / BB) | −100 to 100 °C, ±0.1 °C, 10 °C/min |
| Variable-temperature Raman / microscopy | Battery Raman Stage (ACH80-BE) | −60 to 80 °C, ±0.1 °C, surface and cross-section observation |
| Multi-channel coin-cell cycling vs temperature | Coin-Cell Peltier Test Platform (APE120V-BB) | −25 to 120 °C, thermoelectric control, 4 channels |
Around the stage, the pairings write themselves: the diffractometer per the XRD guide, the spectrometer per the Raman guide, the potentiostat with the contact discipline of the electrical stage guide. And the materials side of the same catalogue closes the loop: ACS Material’s battery materials line supplies electrode and cell-chemistry building blocks for the samples themselves. The stage selector is the fastest route to a configuration conversation.
- InSitu Pro™ Heating & Cooling Stages — the environmental platforms for battery XRD, Raman and electrochemical work; battery-cell configurations by quotation.
- Battery Materials — electrode and cell-chemistry materials from the same catalogue as the instrumentation.
- How to choose an in-situ stage — the five-step selection guide, or go straight to the interactive stage selector.
10. FAQ: In-Situ Battery Research
11. Keep Exploring the InSitu Pro™ Knowledge Hub
This article is the flagship application chapter of the InSitu Pro™ knowledge hub — three probe channels converging on one device. To keep going:
- In-situ heating, cooling & electrical stages: a theory guide — the pillar article on temperature control and stage physics.
- In-situ XRD: watching crystal structure evolve — the diffraction channel in depth.
- Variable-temperature Raman spectroscopy — the vibrational channel in depth.
- In-situ electrical probe stages — the transport channel in depth.
- Operando & correlative microscopy — the methodological frame this application exemplifies.
- How to choose an in-situ heating & cooling stage — the five-step selection guide.
References
This article discusses in-situ and operando battery characterization methodology in general terms. Structural responses, spectral assignments, temperature dependences and cell behaviours are idealized and chemistry-, format- and instrument-dependent; real experimental design and interpretation must be validated against the published literature, applicable safety practices, your own calibrations and the manufacturers’ datasheets before quantitative use. The interactive simulator is a schematic teaching tool built on stated illustrative curves — not measured data for any real electrode, and deliberately simplified relative to graphite’s genuinely staged behaviour. Battery-cell stage configurations, atmospheres and feedthroughs are experiment-specific; contact ACS Material to discuss options for your application.