
The conductivity cell constant is the number that turns what a conductivity probe actually measures, electrical conductance, into conductivity in µS/cm or mS/cm. Getting it right is the first step to trustworthy conductivity, and to the TDS, salinity and resistivity values a meter derives from it. This guide explains what the cell constant is, how calibration sets it, how to choose a cell constant for your samples, and how conductivity relates to TDS and salinity, with a summary of ALab conductivity meters at the end. For the wider picture, see the pH, conductivity and dissolved oxygen meter guide.
Quick answer:
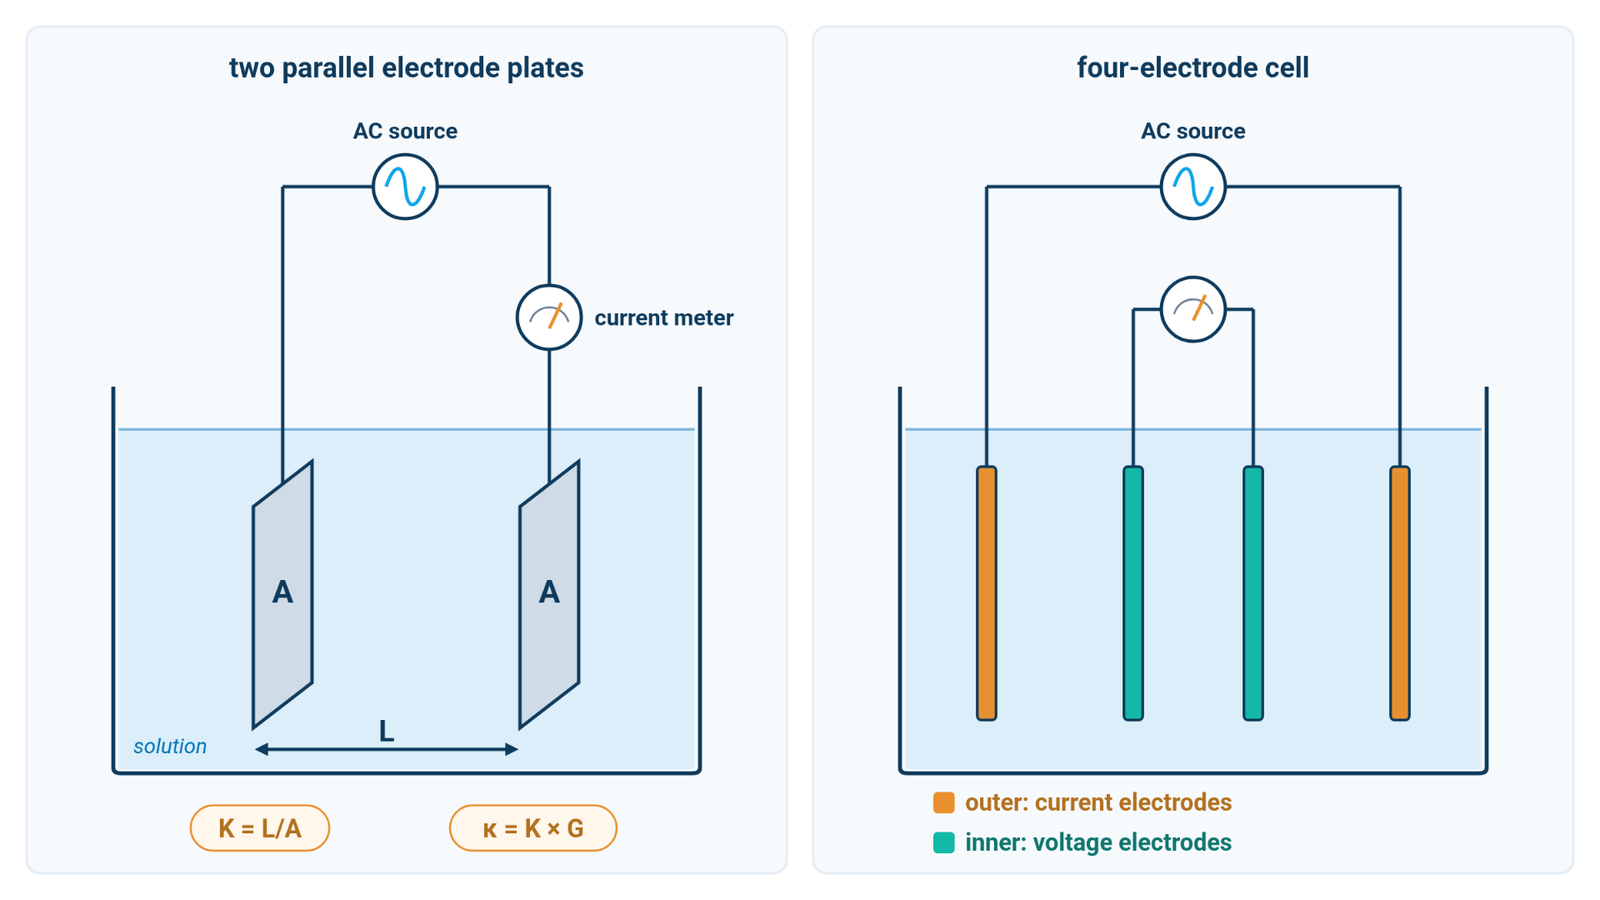
- Cell constant: K = L/A (cm⁻¹) for an ideal cell, the electrode spacing divided by the electrode area. Conductivity κ = K × G, where G is the measured conductance [1][3][4].
- Calibration: a nominal cell constant can be off by about ±20 %, so measure a conductivity standard close to your samples to determine the actual K [3][4].
- Choosing K: the lower the expected conductivity, the smaller the cell constant should be. A K = 1 cell suits the mid range; very pure water calls for about 0.01–0.1 cm⁻¹ [2][3].
- TDS and salinity: both are calculated from conductivity. TDS = TDS factor × κ25, with factors of roughly 0.5–0.9 depending on what is dissolved [1][3][4].
1. What a Conductivity Cell Constant Is
A conductivity probe applies an alternating voltage between electrodes and measures how much current the solution carries [3]. That gives conductance G, in siemens. For an ideal parallel-plate cell, conductance is proportional to electrode area A and inversely proportional to electrode spacing L [1]. Real probe geometries are accounted for by an effective cell constant, established through calibration [3][4]:
- K = L/A, in cm⁻¹, for the ideal cell (for a real probe, K is the effective value found by calibration)
- κ = K × G, so conductivity (S/cm) is conductance multiplied by the cell constant
A cell with K = 1.0 cm⁻¹ that measures a conductance of 1.413 mS therefore reports 1.413 mS/cm, or 1413 µS/cm. If the true cell constant were 0.95 cm⁻¹ while the meter still assumed 1.00, the same sample would really be 1342 µS/cm, so the display would read about 5 % high (calculated illustration, not a specification).
That is why the printed value matters less than the measured one. A nominal cell constant helps you choose a sensor, but it can deviate by about ±20 % from the actual value; certified cell constants determined after manufacture have a maximum uncertainty of about ±2 % [3]. The cell constant can also drift as electrodes become coated or contaminated [3][4].
2. Calibrating the Conductivity Cell Constant
Calibrating a conductivity meter means determining the actual cell constant. You measure a standard solution of known conductivity, and the meter calculates K = κstandard / G, or adjusts its internal cell constant until the reading matches the standard [1][4]. Depending on the meter, you can enter a known cell constant directly, for example a certified value [3], or calibrate against a standard solution.
Potassium chloride (KCl) solutions are the classic reference standards:
| KCl concentration | Conductivity at 25 °C (µS/cm) |
|---|---|
| 0.001 mol/L | 146.9 |
| 0.01 mol/L | 1412 |
| 0.1 mol/L | 12 890 |
Values from Standard Methods 2510 [1]. Other references give slightly different values for nominally similar solutions (for example 1408.8 µS/cm at 25 °C for ASTM D1125 Reference Solution C [2]), so always use the certified value printed for the standard you are using.
Good calibration practice from the literature:
- Calibrate near your samples. For a one-point calibration, choose the standard closest to the expected sample conductivity [4].
- Be careful with low standards. Standards below about 200 µS/cm are especially susceptible to contamination [4], so use fresh solution and handle low standards with extra care.
- Check with a second standard. After calibration, measure another standard as a check [4].
- Track the cell constant. The cell constant of many modern probes stays nearly constant, within about ±2 %. A change of more than 2 % suggests a contaminated standard or a dirty probe [4].
- Control temperature. Conductivity standard values are given at a stated reference temperature, usually 25 °C [1][3]. Temperature coefficients and reference temperature are covered in the guide to temperature compensation in pH and conductivity.
3. How to Choose a Conductivity Cell Constant
The cell constant should keep the measured resistance in a range where the electronics work accurately. Cell resistance is R = K/κ. A small K suits low-conductivity water, while a large K suits concentrated solutions [2][3]:
| Sample conductivity | K = 0.1 cm⁻¹ | K = 1 cm⁻¹ | K = 10 cm⁻¹ |
|---|---|---|---|
| 1 µS/cm | 100 kΩ | 1 MΩ | 10 MΩ |
| 1413 µS/cm | 70.8 Ω | 708 Ω | 7.08 kΩ |
| 100 mS/cm | 1 Ω | 10 Ω | 100 Ω |
Calculated illustration, not a specification.
At very low resistance, electrode polarization limits linearity at the high end of the range; at very high resistance, cable and cell capacitance distort readings of low-conductivity samples [3]. For laboratory bridge measurements, ASTM D1125 provides conservative guidance on cell constants by conductivity range [2]:
| Conductivity range (µS/cm) | Recommended cell constant (cm⁻¹) |
|---|---|
| 0.05–10 | 0.01–0.1 |
| 10–200 | 0.1–1.0 |
| 200–5000 | 1.0–10 |
| 5000–1 000 000 | 10–100 |
From ASTM D1125 [2]; the bands overlap at their edges.
Cell design matters as well. Two-electrode (2-pole) cells are recommended for low conductivity, while four-electrode (4-pole) cells reduce polarization effects and suit mid to high conductivity [2][3]. For very pure water, below about 10 µS/cm, ASTM D1125 calls for a flow-through or in-line cell to avoid contamination from the air, whose carbon dioxide can strongly raise the reading, and its Table 2 points to a small cell constant [2][3].
In practice, a conductivity probe with K = 1 sits where the 0.1–1.0 and 1.0–10 cm⁻¹ bands meet, which covers most drinking water (typically about 50–1500 µS/cm [1]) and many laboratory solutions. Standard Methods notes that the 0.01 mol/L KCl standard is satisfactory for most samples when the cell constant is between 1 and 2 cm⁻¹ [1]. Cells with smaller or larger constants are for the extremes: about 0.01–0.1 cm⁻¹ for pure water and 10 cm⁻¹ or more for concentrated solutions [2].
4. Conductivity vs TDS: The TDS Factor
Total dissolved solids (TDS) is, strictly, a gravimetric quantity: filter the sample, evaporate the filtrate, dry the residue at 180 °C and weigh it [5]. That method is accurate but slow. A conductivity meter instead estimates TDS from conductivity at 25 °C [3]:
TDS (mg/L) = TDS factor × κ25 (µS/cm)
The TDS factor depends on dissolved composition. Reported ranges are about 0.55–0.9 [1] or 0.5–0.9 [4]; for natural waters, 0.55–0.70 is typical and 0.65 is often used [3]. Single salts differ:
| Salt | TDS factor |
|---|---|
| NaCl | 0.49 |
| Na₂SO₄ | 0.67 |
| CaSO₄ | 0.74 |
| NaHCO₃ | 0.91 |
From the Mettler-Toledo conductivity guide [3].
For a sample at 1000 µS/cm (25 °C), factors of 0.55, 0.65 and 0.9 give 550, 650 and 900 mg/L (calculated illustration, not a specification). The choice of factor alone can move the result by more than 60 %.
Two limitations follow [3]:
- Only ions conduct. Non-ionic solids such as sugar add to true TDS but not to conductivity.
- The factor is an extra error source. TDS from conductivity is typically within about 15 % of the true value, provided the sample composition varies only slightly.
For the best estimate, determine a site-specific factor: measure TDS gravimetrically on representative samples, then divide by κ25 [3][5].
5. Salinity and Resistivity from Conductivity
Salinity measurement with a conductivity meter is also indirect. Conductivity is the most precise route to salinity, but it responds only to ionic solutes [6]. For seawater, the Practical Salinity Scale 1978 (PSS-78) defines practical salinity from the ratio of a sample's conductivity to that of a standard KCl solution at 15 °C [7]. Its equations are valid for practical salinity from 2 to 42 and temperatures from −2 to 35 °C [8]. Outside that range, or in waters whose ionic composition differs from seawater, conductivity-based salinity is an approximation.
Resistivity is simply the inverse of conductivity, ρ = 1/κ, and is preferred for very pure water [3]. Pure water at 0.055 µS/cm corresponds to 18.18 MΩ·cm [3].
6. Conductivity, TDS and Salinity on ALab Meters
ALab conductivity meters report salinity and resistivity alongside conductivity. Where available, TDS is estimated from conductivity with a conversion factor, and salinity is also calculated from conductivity, so both carry the limits described in sections 4 and 5. The salinity ranges below are meter ranges, not the validity range of a salinity scale. Kit probes and calibration options:
| Series | Models | Conductivity probe in kit | Conductivity calibration | Standards in kit | Accuracy |
|---|---|---|---|---|---|
| Portable (pH/Cond/DO) | DPCD10 | CON201T (plastic), K=1.0 | One point; probe constant or standard solution | 84 µS/cm, 1413 µS/cm, 12.88 mS/cm (50 mL each) | ±0.5 % F.S ±1 digit |
| Portable | DEC10, DPC10, DCD10 | CON201T (plastic), K=1.0 | One point; probe constant or standard solution | 84 µS/cm, 1413 µS/cm, 12.88 mS/cm (50 mL each) | ±0.5 % F.S ±1 digit |
| Touchscreen | DEC100T, DPC100T, DCD100T, DPCD100T | CON201TG (glass), K=1.0 | One point | 84 µS/cm, 1413 µS/cm, 12.88 mS/cm (50 mL each) | ±0.5 % F.S ±1 digit |
| Classical | DEC100, DPC100, DCD100, DPCD100 | CON201T (plastic), K=1.0 | One point | 84 µS/cm, 1413 µS/cm, 12.88 mS/cm (50 mL each) | ±1.0 % F.S ±1 digit |
| DEC1, DEC1+, DPC1, DPC1+ | EC1-S (DEC1/DEC1+) or PC1-S (DPC1/DPC1+); pre-installed | — | 1413 µS/cm, 12.88 mS/cm (30 mL each) | ±1.0 % F.S ±1 digit |
For entries marked "—", contact us to discuss the parameter.
Derived quantities:
| Series | TDS | Salinity | Resistivity |
|---|---|---|---|
| Portable, incl. DPCD10 | TDS factor adjustable | 0–100 ppt | 5.000 Ω·cm – 100.0 MΩ·cm |
| Touchscreen | TDS factor adjustable | 0–100 ppt | 5.000 Ω·cm – 100.0 MΩ·cm |
| Classical | — | 0–100 ppt | 5.00 Ω·cm – 100.0 MΩ·cm |
| 0.0 mg/L – 10.0 g/L, TDS factor adjustable | 0–10 ppt | 50 Ω·cm – 20 MΩ·cm |
For entries marked "—", contact us to discuss the parameter.
How to read the tables:
- Auto-ranging. The Portable, DPCD10 and Touchscreen meters have auto-ranging segments from 0–19.999 µS/cm through 20.00–199.9 mS/cm, the Classical meters from 0–19.99 µS/cm through 20.00–199.9 mS/cm, and the Pocket Testers from 0–19.99 µS/cm through 2.00–19.99 mS/cm. These are meter ranges, not probe ranges: whether the K=1.0 probe supplied with the benchtop and portable kits suits samples near either end depends on the sample and the method (section 3).
- One-point calibration. With three standards in the benchtop and portable kits, calibrate with the one closest to your samples and use another as a check (section 2).
- Accuracy as % F.S. The percentages are meter accuracy relative to full scale, not to the reading, and they are not the total uncertainty of a measurement. The absolute meter error therefore depends on the range in use and the ±1 digit term. Verify with a standard near your samples.
- TDS factor. Where the TDS factor is adjustable, set a factor that fits your water (section 4) rather than relying on a generic value.
- Kits and pricing. Probe and kit configurations are confirmed on the quotation. For pricing, request a quote or contact us.
For portable conductivity, TDS, salinity and resistivity measurements alongside pH and dissolved oxygen, with both probe-constant and conductivity-standard calibration options, explore the ALab™ DPCD10 Portable pH/Conductivity/Dissolved Oxygen Meter.
7. Frequently Asked Questions
What is a conductivity cell constant?
For an ideal cell, the ratio of electrode spacing to electrode area, K = L/A, in cm⁻¹; for a real probe, the effective value is found by calibration. The meter multiplies the measured conductance by K to report conductivity [1][3].
Why calibrate if the probe is labelled K = 1.0?
A labelled value is nominal and can differ from the actual cell constant by up to about ±20 %, and the cell constant changes as the electrodes age or become coated. Calibration measures the actual value [3][4].
Can I measure ultrapure water with a K = 1 probe?
Not ideally. For water below about 10 µS/cm, use a flow-through or in-line cell with a small cell constant (about 0.01–0.1 cm⁻¹) to avoid contamination from the air [2][3].
Is a TDS reading from a conductivity meter exact?
No. It estimates TDS from conductivity using an empirical factor and cannot account for non-ionic dissolved solids. For a direct, method-defined TDS result, use the gravimetric method [3][5].
8. Keep Exploring the pH, Conductivity and DO Hub
- Temperature compensation in pH and conductivity: ATC, the Nernst slope and reference temperature.
- pH, conductivity and dissolved oxygen measurement: principles, calibration and choosing a meter.