
Choosing the annealing temperature in PCR is a balance between specificity and yield. Too low can permit mispriming and extra bands; too high can suppress the intended product. Rychlik and colleagues reported that non-specific products and reduced yield could occur at both sub-optimal and super-optimal annealing temperatures [1]. A primer Tm calculation gives a sensible starting point, but different formulas and buffer assumptions can disagree by several degrees for the same primer. Gradient PCR settles the question by experiment: one run tests a range of annealing temperatures side by side, and the gel shows which one gives a single, strong band. This guide covers the annealing step, Tm estimates, gradient blocks and specifications, and touchdown PCR. For where this step sits in the wider bench workflow, see From Extraction to Gel Viewing: A Molecular Biology Bench Workflow with PCR, qPCR and Electrophoresis.
Quick answer:
- Start from Tm, not at Tm: to set a PCR annealing temperature, calculate the Tm of both primers with a nearest-neighbour calculator set to your buffer, then start the annealing step a few degrees below the lower Tm, or slightly above it for polymerases whose manufacturer recommends that [2][3].
- Then test it: a gradient PCR run sets different annealing temperatures across the block in a single run, so you compare several temperatures on one gel instead of repeating runs [1].
- Read the result, not the formula: pick the highest temperature that still gives a strong band of the expected size with no extra bands; the answer belongs to that primer pair, template, buffer and cycler, not to the primer alone.
- Touchdown is the alternative: touchdown PCR starts above the expected annealing temperature and steps down over cycles, which favours the correct product when the right temperature is unknown [4][5].
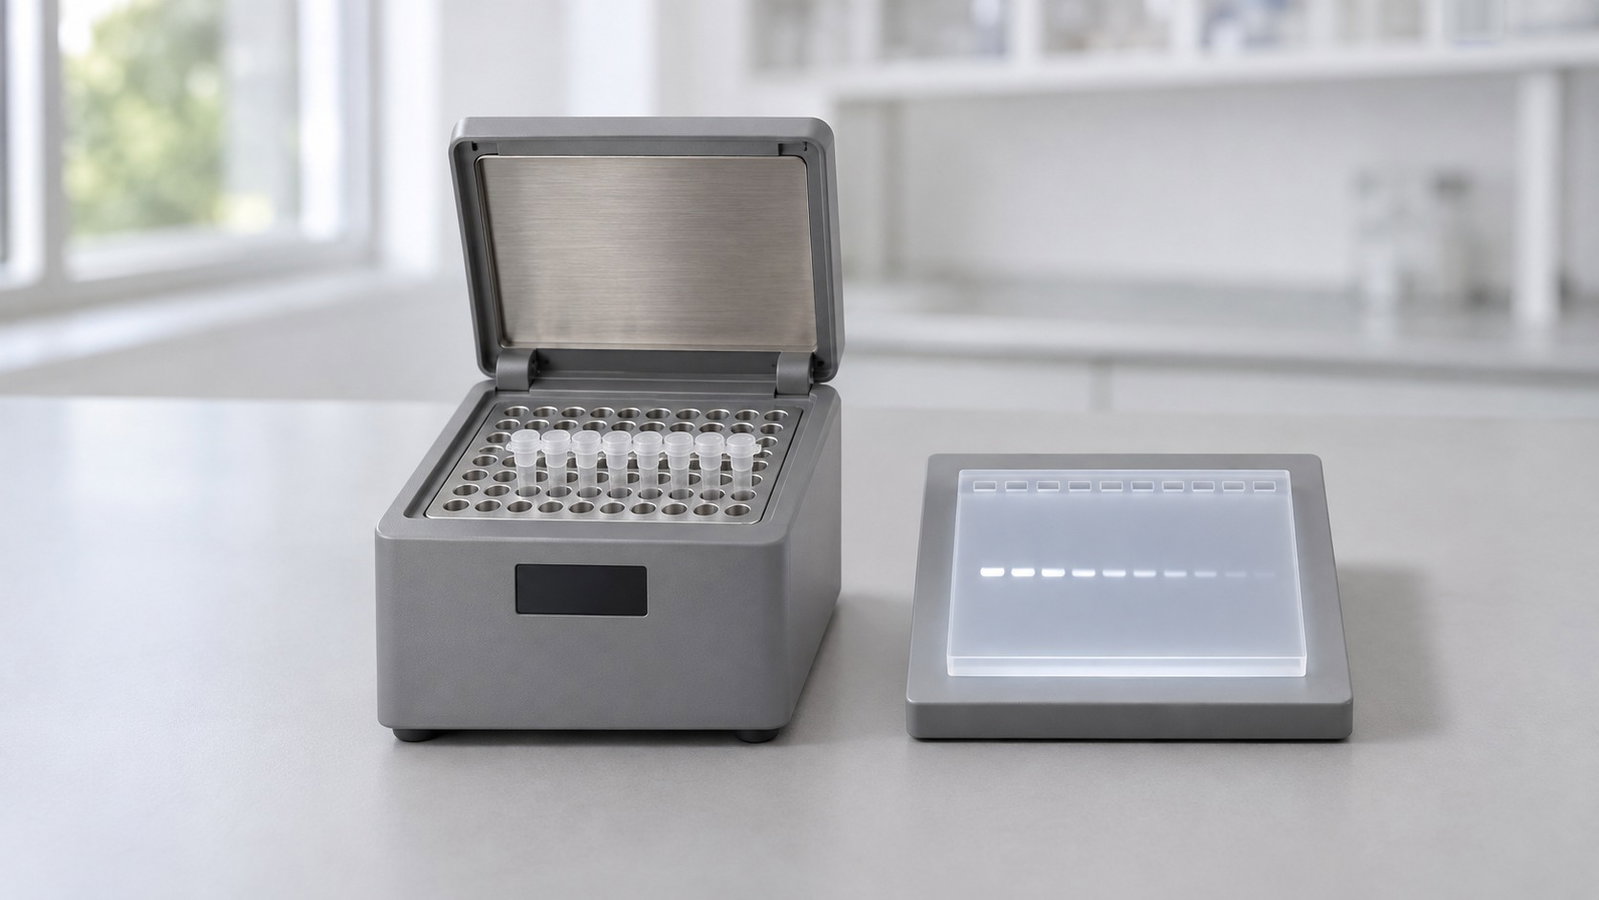
1. What the Annealing Temperature Does
In each PCR cycle, denaturation separates the strands, annealing lets the primers bind and extension copies the template. The annealing temperature (Ta) controls how choosy that binding is. At a lower Ta, some partially matched primer–template duplexes can persist long enough for polymerase extension. At a higher Ta, partly matched duplexes fall apart and the perfectly matched site wins, until the temperature gets so close to the primer's melting point that even the correct duplex is too short-lived and yield drops [1].
Running PCR at higher temperatures with a thermostable polymerase was shown early on to improve specificity, yield and product length [6]. Wallace and colleagues found that, in the oligonucleotide duplexes they tested, a single-base mismatch lowered dissociation temperature by about 10 °C relative to the matched duplex [7]. Treat that result as an illustration of mismatch discrimination, not a universal 10 °C window for every primer pair.
Rychlik and colleagues measured the optimum directly. For their primer–template pairs, too low a Ta gave multiple bands on agarose gels, while too high a Ta cut the yield of the desired product [1]. They found the optimum depended on the Tm of the less stable primer–template pair and on the Tm of the product, and they fitted an empirical formula to it [1]. A PCR optimisation review identifies annealing temperature as the most important cycling condition and notes that it interacts with Mg²⁺, dNTP concentration and buffer composition [8]. The optimum Ta is a property of the whole reaction, not of the primer alone.
2. Estimating Tm: A Primer Tm Calculation Is a Starting Point
A primer Tm calculation estimates the temperature at which half of the primer molecules are bound to their perfectly complementary strands under the specified solution conditions. Three families of method are in common use [2][9]:
- Counting rule. Tm ≈ 4 °C for each G or C plus 2 °C for each A or T. It is quick by hand but ignores sequence order, salt and primer concentration [2].
- Salt-adjusted formulas. These add terms for length, GC content and monovalent salt, and improve on the counting rule but remain approximate [9].
- Nearest-neighbour models. These sum measured stacking energies for each pair of neighbouring bases, then correct for salt and primer concentration [10]. A unified parameter set derived from 108 oligonucleotide duplexes describes both short oligonucleotides and longer DNA well [10].
The parameter set and the salt correction both matter. When the earlier Breslauer nearest-neighbour parameters were tested against the unified data set, their predicted Tm values were off by about 6 °C on average [10][11]. Improved sodium corrections cut the average error to about 1.6 °C on an independent validation set [12], and a later model added magnesium, which dominates duplex stability under typical PCR conditions of 1.5–5 mM Mg²⁺ and 20–100 mM monovalent cations [13][14]. A comparison of Tm methods for 16–30 nt oligonucleotides found significant differences between them [15], so two calculators can disagree about the same primer.
| Hypothetical 20-mer (50 % GC) | Counting rule | Nearest-neighbour, 1 M Na⁺ | Nearest-neighbour, 50 mM Na⁺ |
|---|---|---|---|
| Primer F: AGCGTCAACTGGATCCTAGA | 60 °C | 70.8 °C | 55.2 °C |
| Primer R: TCAGGTTGCAAGTGCTTACC | 60 °C | 71.1 °C | 55.8 °C |
Table 1. Same primers, three Tm estimates.
Calculated illustration, not a specification. Inputs: two made-up 20-nt primers; the counting rule as above [2]; nearest-neighbour Tm from the unified 1 M NaCl parameters with 0.5 µM total primer, then the published sodium entropy correction to 50 mM Na⁺ [10]. Mg²⁺ and dNTPs are ignored, so these numbers are not what a buffer-aware calculator would report. The point is the spread: identical sequences, estimates about 15 °C apart depending on method and assumed salt.
Calculate both primers with the same method, ideally a nearest-neighbour calculator set to your primer concentration, Mg²⁺ and salt [2][9]. Aim for primer Tm values within about 5 °C of each other [2][3]. Then turn the Tm into a starting Ta using your polymerase manufacturer's rule: one general protocol sets annealing about 5 °C below the primers' Tm [2], while one polymerase manufacturer's guidelines give 0–2 °C below the lower Tm for most of its enzymes and 0–3 °C above it for two high-fidelity enzymes [3]. That difference alone is a good reason to test.
3. How a Gradient Block Works
In a normal run, every well follows the same programme. In a gradient run, the cycler holds part of the block warmer than the rest during annealing, so different positions see different annealing temperatures in the same cycle. You load the same mix into each position, run once and compare the products.
The gradient is described by two settings: a low and a high temperature (or a centre temperature and a span), and the instrument works out the set temperature for each position in between. How those positions are laid out, and how the temperatures are distributed across them, is specific to each instrument, so read the position-by-position temperatures from your cycler's screen or manual rather than assuming even steps.
| Assumed position | 1 | 2 | 3 | 4 | 5 | 6 | 7 | 8 |
|---|---|---|---|---|---|---|---|---|
| Set Ta (°C) | 54.0 | 55.7 | 57.4 | 59.1 | 60.9 | 62.6 | 64.3 | 66.0 |
Table 2. A 12 °C span spread evenly over eight positions.
Calculated illustration, not a specification. Inputs: a hypothetical block with eight positions, a 54–66 °C gradient and even spacing, giving steps of about 1.7 °C. It is not the layout of any ALab cycler. It shows the trade-off: a wider span covers more ground in coarser steps, a narrower span gives finer steps over less ground. The right span depends on how confident you are in the Tm estimate.
Rychlik's group did the same by hand, with six annealing temperatures 1–5 °C apart [1]. A gradient run also reflects the temperature profile of the cycler you actually use. A study of 19 thermal cyclers across eight models found profile curvature, undershoot, overshoot and well-to-well variation that affected a temperature-sensitive multiplex PCR assay [16]. An empirical optimum found on your own instrument therefore reflects those instrument-specific effects.
4. Reading a Cycler's Gradient Specification
Four specification lines matter for gradient PCR:
- Gradient temperature range: the lowest and highest annealing temperatures the gradient can be set to.
- Gradient span: the largest difference allowed between the coolest and warmest positions in one run.
- Uniformity at a specified temperature: how evenly the block holds a single, non-gradient set point, at the test temperature given. It is not a measure of how closely each gradient position matches its own set point.
- Maximum rate of temperature change: the highest heating or cooling rate the block can reach. It is a maximum, not the rate across every step, and it is not how fast the liquid in a tube follows.
A display resolution, meaning how many decimal places the screen shows, is a different thing from temperature control accuracy. Neither tells you the temperature inside a particular tube [16].
| Model | Gradient range | Gradient span | Module | 0.2 mL 96-well plate |
|---|---|---|---|---|
| TC1000-G-Pro | 30–105 °C | 1–42 °C | 1×96 | Yes |
| TC1000-S+ | — | — | 1×96 | Yes |
| TC2000-G1 | 30–105 °C | 1–42 °C | 1×96 | Yes |
| TC2000-G2 | 30–105 °C | 1–25 °C | 2×48 | — |
| TC2000-G3 | 30–105 °C | 1–25 °C | 3×32 | — |
Table 3. Gradient settings and sample formats.
Note: — in the gradient columns indicates a non-gradient model; — in the plate column means that a 0.2 mL 96-well plate format is not specified.
How to read the table:
- TC1000-S+ is the non-gradient model; its gradient fields are shown as "—". On the gradient models, the span is set from 1 °C upward, and you can "enter 0 to turn off the gradient".
- All five models list 96×0.2 mL PCR tubes and 12 PCR-8 strips. A 0.2 mL 96-well plate is specified for TC1000-G-Pro, TC1000-S+ and TC2000-G1; for TC2000-G2 and TC2000-G3 the specified formats are tubes and 8-strips, shown as "—" in the plate column.
- Shared block figures: all five list a 0–105 °C sample-module range, a 30–115 °C hot-lid range, ±0.1 °C temperature-control accuracy as a single-set-point specification, ±0.2 °C temperature uniformity at 55 °C and a maximum rate of temperature change of 5 °C/s. Neither the ±0.1 °C nor the ±0.2 °C figure describes the accuracy of individual gradient positions; the uniformity value applies at 55 °C only.
For gradient work on one 1×96 block or on two or three separate modules, see the ALab™ TC2000-G1/G2/G3 Thermal Cycler Gradient to view the product or request a quote.
5. Setting Up a Gradient PCR Run
A workable sequence:
- Check the template first. Poor-quality DNA can mimic a bad Ta. Spectrophotometric purity ratios are a quick screen; see DNA and Protein Quantification by UV Absorbance: The A260/A280 Ratio, A260/A230 and Purity Checks.
- Make one master mix. Prepare enough for every position plus a no-template control, so the gradient is the one variable [2].
- Centre the gradient on your estimate. Put the calculated starting Ta near the middle, with the span reaching a few degrees below and above it. If your Tm estimates disagree widely, start with a wider span; if you are fine-tuning a known reaction, use a narrower one.
- Keep everything else fixed, and record the position-to-temperature map shown by the cycler's screen or manual, along with the tube assigned to each position.
- Run the gel. Load the samples in that recorded position order next to a DNA ladder, so each lane can be matched to its programmed temperature. How to choose the gel percentage for your product size is covered in Agarose Gel Percentage and DNA Fragment Size: Choosing and Running a Horizontal Gel.
Reading the gel. At the cool end you may see extra bands or a smear; moving warmer, the extra bands fade; at the warm end the correct band weakens or disappears [1][2]. Choose a temperature on the warm side of the clean region, where the expected band is still strong; the extra stringency gives margin when template or reagent lots change. If no position gives a clean band, first check that the gradient span brackets a useful Ta and that the position-to-temperature map is correct; if both check out, revisit primer design, Mg²⁺, additives and template quality (section 8).
Hot-start methods can reduce pre-cycling mispriming. Mispriming and primer-dimers can form while tubes sit at room temperature before cycling. Hot-start approaches delay polymerase activity until the reaction has heated; examples include a wax barrier [17], an antibody-blocked enzyme, or adding polymerase after the initial denaturation [2].
For real-time work, the ALab™ Accurate 96 Real-Time PCR System lists a temperature gradient setting range of 30–100 °C and a gradient difference setting range of 1–36 °C; quantification itself is covered in qPCR Basics: Ct Values, Standard Curves and Amplification Efficiency.
6. Touchdown PCR: Stepping Down Over Cycles
Touchdown PCR changes the annealing temperature over time instead of across the block. The original method lowered the annealing temperature by 1 °C every second cycle from 65 °C to a "touchdown" at 55 °C, then ran 10 more cycles there [4]. The logic is exponential: whichever product starts amplifying first, at the most stringent temperatures, gets a head start. All else being equal, a Tm difference between correct and incorrect annealing gives the correct product a twofold advantage per cycle—about fourfold per degree when the temperature drops 1 °C every two cycles [4][5].
A typical protocol starts about 10 °C above the calculated Tm, lowers the annealing temperature 1 °C every second cycle down to the Tm or slightly below, then runs 20–25 cycles at about 5 °C below Tm [2]. Experiments on touchdown confirmed that priming begins above the optimum annealing temperature, giving the target a competitive edge, while the later, lower temperatures raise yield without spurious products; "stepdown" versions use fewer, larger steps and are simpler to programme [18].
Touchdown and gradient PCR are complementary rather than rival methods:
- Use a gradient when you will run the same primer pair many times and want a fixed, documented Ta for routine use.
- Use touchdown when the optimal annealing temperature is uncertain or a template is difficult to amplify, and you want a single programme that can improve amplification specificity without extensive prior optimisation [5][18].
How touchdown is programmed depends on the cycler. The TC1000-G-Pro lists Touchdown PCR (−9.9 °C to +9.9 °C) and Long PCR (−9 min 59 s to +9 min 59 s) experiments. Long PCR here is a programme setting with that time range, not a statement about how long an amplicon can be. The TC2000 series lists "support for Touch down PCR and Long PCR experiments", with up to 30 steps and 199 cycles in a single program and a skip-to-next-step function.
For a 1×96 gradient model with those touchdown and Long PCR settings, plus a non-gradient model on the same platform, see the ALab™ TC1000-G-Pro & TC1000-S+ Gene Amplification Instruments to view the product or request a quote.
7. Single Block vs Multi-Module Cyclers
A single gradient block runs one gradient programme at a time, so every primer pair on it shares the same temperature range. A multi-module cycler adds another option: on TC2000-G2 and TC2000-G3, the "multi-channel module design can run several different PCR gradient programs at the same time". One module can run a gradient for a new primer pair while another runs a different programme.
| Model | Modules | Display | Power | Dimensions (W×D×H) | Weight |
|---|---|---|---|---|---|
| TC1000-G-Pro, TC1000-S+ | 1×96 | 7-inch, 1024×600 | 600 W | 296×370×295 mm | 9.5 kg |
| TC2000-G1 | 1×96 | 10.1-inch, 1280×800 | 600 W | 310×422×264 mm | 11 kg |
| TC2000-G2 | 2×48 | 10.1-inch, 1280×800 | 1000 W | 310×422×264 mm | 11 kg |
| TC2000-G3 | 3×32 | 10.1-inch, 1280×800 | 1500 W | 310×422×264 mm | 11 kg |
Table 4. Format, interface and footprint.
Questions to ask when choosing between formats:
- How many primer pairs do you optimise at a time? Pairs that fit one temperature range can run together on a single gradient block; pairs that need different ranges or programmes at the same time suit separate modules.
- What sample format do you use? Plate users should check the plate column in Table 3.
- How wide a gradient do you need? Check that the span you plan fits the gradient span for that model (Table 3).
- Do you need a gradient at all? Routine runs at a fixed Ta do not use one; the TC1000-S+ is the non-gradient model on the TC1000 platform.
8. Troubleshooting Annealing Problems
| What you see | Likely annealing-related cause | What to try |
|---|---|---|
| Several bands or a smear | Ta may be too low; mispriming | Raise Ta incrementally or run a gradient; consider touchdown [1–3] |
| Faint or no band | Ta too high, or Mg²⁺ too low | Lower Ta; check Mg²⁺ and template quality [1][2][8] |
| Low band near the bottom of the gel | Primer-dimer | Hot start; check 3′ complementarity of the primers [2][17] |
| Clean at one Ta, messy on another day | Margin too small | Choose a slightly warmer Ta within the clean region [1][16] |
| No clean temperature in the gradient | The span may miss a usable Ta, or another reaction variable may be limiting | Recenter or adjust the span; check the position map; then revisit primer design, Mg²⁺, additives and template quality [2][8] |
Table 5. Common patterns on a gradient gel.
Two interactions matter. dNTPs bind Mg²⁺ and lower the free concentration available to the polymerase, so changing one shifts the optimum of the other [8]. Additives such as DMSO, formamide or betaine change duplex stability, so re-check the Ta after adding them [2]. In one protocol example, dropping the annealing temperature from 61 °C to 58 °C turned a clean product into non-specific bands and a smear [2]. If two primers have very different Tm values, no single Ta suits both, and redesigning one primer may save time [2].
9. Frequently Asked Questions
What is a good annealing temperature for PCR?
Start a few degrees below the lower primer Tm from a buffer-aware calculator, or follow your polymerase manufacturer's rule, then confirm with a gradient run. Lorenz gives 52–58 °C as the optimal range for primer Tm and sets the annealing step about 5 °C below the primers' Tm [2]. The right Ta belongs to your primers, template and buffer [2][3].
Why do different Tm calculators give different answers?
They use different equations, parameter sets and default salt, Mg²⁺ and primer concentrations. A comparison of methods for 16–30 nt oligonucleotides found significant differences between them [15].
How wide should the gradient span be?
Wide enough to bracket your uncertainty and narrow enough to give useful steps. If your Tm estimates disagree by several degrees, use a wider span first, then a narrower one around the clean region.
Should I use touchdown PCR or gradient PCR?
It depends on the job. Touchdown gives a programme likely to work without prior optimisation; a gradient gives a fixed temperature for routine use [4][5][18].
Does a gradient cycler need a 96-well plate?
No. Gradient runs work in tubes and 8-strips. On the ALab models, a 96-well plate is specified for TC1000-G-Pro, TC1000-S+ and TC2000-G1, while TC2000-G2 and TC2000-G3 list tubes and 8-strips.
Does the Ta I find transfer to another cycler?
Treat it as a starting point. Instruments differ in how closely wells follow the set temperature [16], so a quick gradient check on the new cycler is worthwhile.
10. Related Guides
- From Extraction to Gel Viewing: A Molecular Biology Bench Workflow with PCR, qPCR and Electrophoresis
- qPCR Basics: Ct Values, Standard Curves and Amplification Efficiency
- Agarose Gel Percentage and DNA Fragment Size: Choosing and Running a Horizontal Gel