
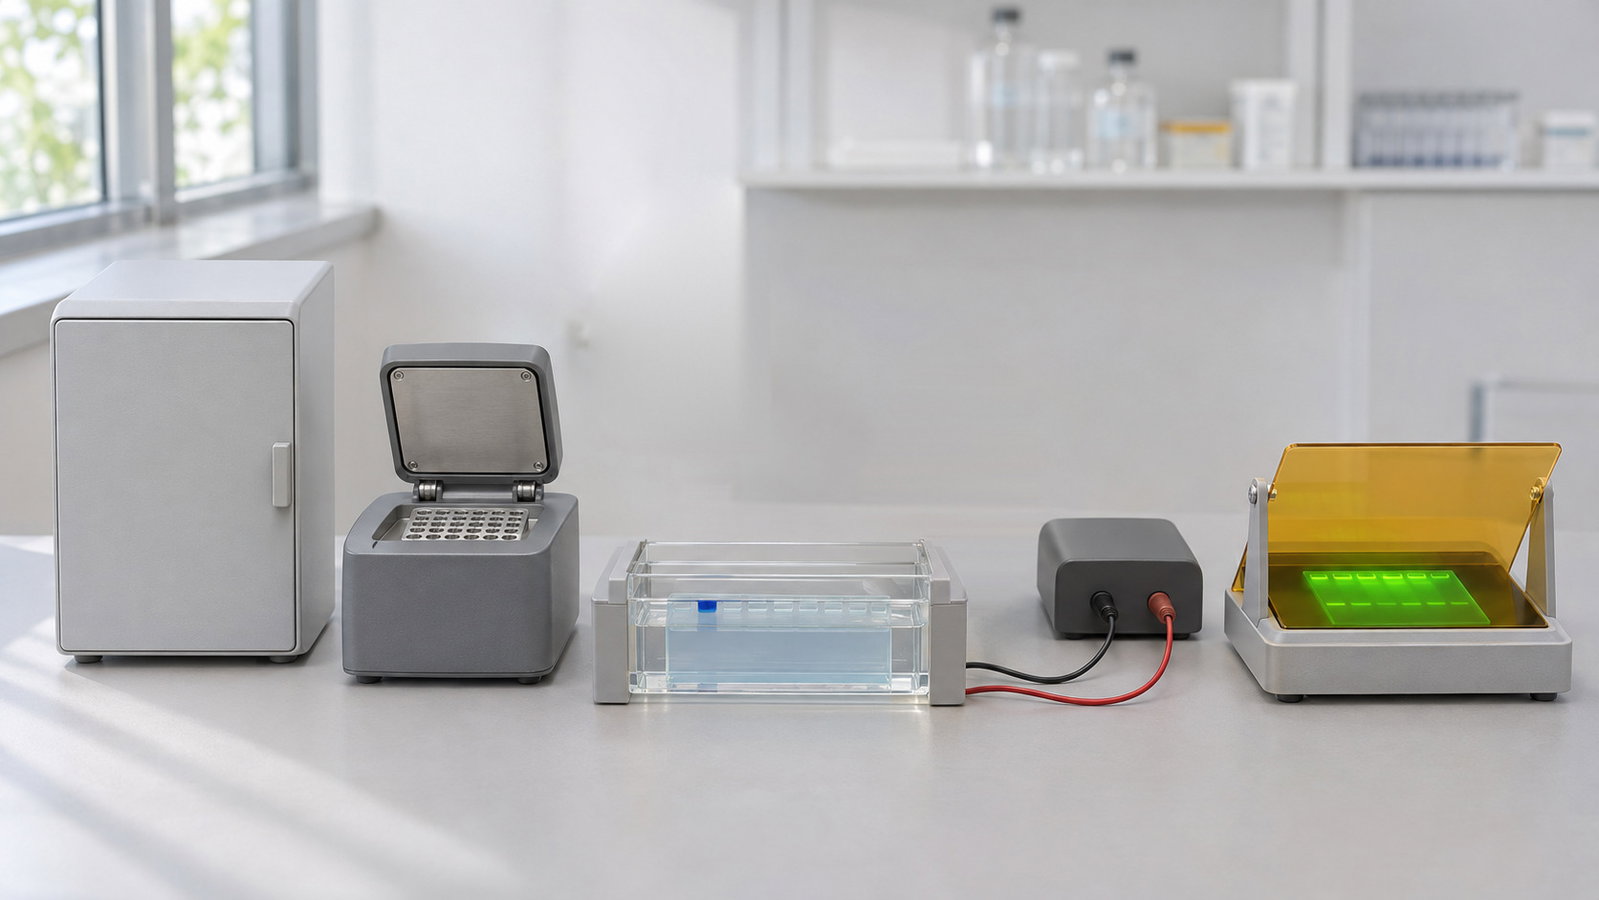
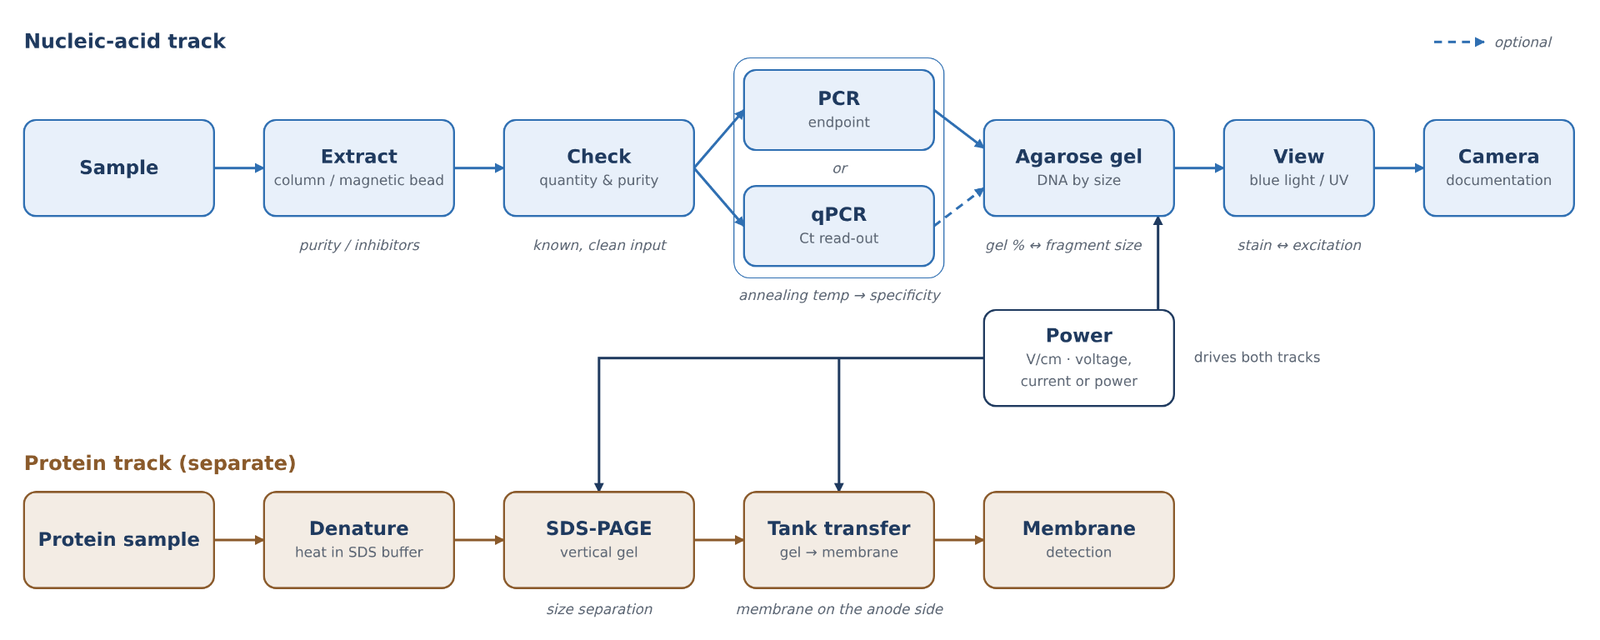
PCR and gel electrophoresis sit at the centre of a chain of bench steps, and each step hands the next one a sample that either works or does not. A typical research workflow runs from extraction to a quantity and purity check, then to endpoint PCR or real-time qPCR, then to an agarose gel, a power supply and a light source for viewing the bands [1–3]. Protein work follows its own side track through SDS-PAGE and Western transfer. This guide walks through a DNA extraction, PCR and gel electrophoresis workflow one hand-off at a time: what each step needs from the one before it, which settings decide the result, and where to read more.
Quick answer:
- Extract clean template: column and magnetic-bead methods both bind nucleic acid under one set of conditions, wash it and release it under another; carry-over of salts, detergent or beads can stall PCR [1][2][4][5].
- Check before you amplify: measure quantity and purity so the PCR receives a known, clean input.
- Set the annealing temperature: too low can allow mismatched primer binding and non-specific products; too high can weaken primer binding and reduce or prevent amplification. A gradient run can help identify a suitable range [2][6].
- Read the product: endpoint PCR is read on a gel; qPCR reads fluorescence every cycle and reports the cycle at which it crosses a threshold. A melt curve helps assess product specificity, while a gel can check product size and reveal additional bands [7][8].
- Run and view the gel: agarose percentage, field strength and buffer decide separation, and the stain decides whether blue light or UV is the right light source [3][9][10].
1. Extraction: Column and Magnetic-Bead Principles
Every downstream step depends on the template. Extraction has to break cells open, protect the nucleic acid from nucleases, separate it from proteins, lipids and salts, and hand it over in a small volume of a buffer that the polymerase tolerates. Solution-based methods such as phenol–chloroform extraction and alcohol precipitation still work, but much routine work now uses solid-phase methods, in which the nucleic acid is held on a surface while everything else is washed away [1].
Column (silica) methods. A classic solid-phase route lyses the sample in a chaotropic salt such as guanidinium thiocyanate, which both disrupts cells and inactivates nucleases. Under these conditions nucleic acid binds to silica particles, and the bound DNA and RNA can then be washed and recovered [4]. The same chemistry explains the older observation that DNA binds to glass in the presence of sodium iodide [11]. In a spin column, the silica sits as a membrane and each liquid is pulled through under centrifugal force. After binding, an alcohol-containing wash buffer removes salts and other contaminants, the wash is discarded, and the DNA is eluted in a low-salt buffer or water [1].
Magnetic-bead methods. Magnetic beads provide another solid-phase route: nucleic acid binds to a bead support, contaminants are washed away and the nucleic acid is eluted [5].
Carry-over and inhibitors. Salt, detergent and EDTA can interfere with downstream PCR [1][2]. The extraction method and its protocol determine the appropriate wash and elution steps; the important hand-off is an eluate that does not carry inhibitors into amplification.
For labs planning to move extraction onto an instrument, one example of an automated extraction system is the ALab™ MNE-96-03 Fully Automated Nucleic Acid Extraction System. Its sample range and processing volume appear in Table 1 (§8).
Check quantity and purity before PCR. An extract that looks clear can still be too dilute, too concentrated or contaminated. Absorbance at 260 nm gives a quick estimate of concentration, and the A260/A280 and A260/A230 ratios flag protein and chaotropic-salt or phenol carry-over before you commit the sample to PCR; see DNA and Protein Quantification by UV Absorbance: The A260/A280 Ratio, A260/A230 and Purity Checks. Recording the template input makes the reaction conditions traceable; however, endpoint band intensity is not a direct quantitative measurement of the starting template.
2. PCR: Cycling and Annealing Temperature
PCR copies a defined stretch of DNA through repeated cycles of three temperature-dependent steps: denaturation of the double strand, annealing of the primers to the template and synthesis by a thermostable DNA polymerase [6]. A heat-stable polymerase let the whole reaction run at higher temperatures, which improved the specificity, yield and length of the products that could be amplified [12]. A typical protocol starts with a short initial denaturation, about one minute at 94 °C in a common example, and then runs 25 to 35 cycles [2].
Annealing and optimisation. Primer annealing conditions affect specificity and yield, and a suitable annealing temperature, gradient span or touchdown programme depends on the assay. Below the optimal annealing temperature, primers may tolerate mismatches and bind at unintended sites, producing non-specific products. Above the optimum, primer binding can become too weak, reducing the yield or preventing amplification [6]. Detailed optimisation is covered in Gradient PCR: Finding the Optimal Annealing Temperature.
For this stage, the ALab™ TC2000-G1/G2/G3 Thermal Cycler Gradient is one thermal-cycler option; the TC1000-G-Pro and TC1000-S+ models are also included in Table 1.
What the gel tells you after PCR. An endpoint PCR is judged on a gel. One sharp band at the expected size suggests a specific product; a ladder of bands or a smear suggests non-specific priming, and no band at all may point to template, primer or cycling problems [2]. This is why the PCR step and the gel step are planned together: the size of the expected product decides the gel percentage and the ladder (§4).
3. qPCR: From Bands to Ct Values
Real-time PCR (qPCR) follows fluorescence as amplification proceeds [7]. The cycle at which a reaction's fluorescence crosses a set threshold is reported as Ct (the quantification cycle, Cq, in MIQE terms). Ct depends on baseline and threshold settings, so it is not an absolute property of a sample. Standard curves and melt curves provide additional context for interpreting amplification and product specificity [8][13][14].
Calculated illustration, not a specification. Inputs are hypothetical, not a recommended setting and not an ALab specification: at 100 % efficiency, a tenfold dilution corresponds to log2(10) ≈ 3.32 cycles between adjacent standards.
Real assays rarely achieve exactly 100 % efficiency. An apparent efficiency above 110 % is a warning sign for an artefact such as inhibition in concentrated standards, pipetting error or primer-dimer signal. Detailed Ct interpretation, standard curves, efficiency and melt-curve analysis are covered in qPCR Basics: Ct Values, Standard Curves and Amplification Efficiency.
Two instrument features come first when laying out a run: well count and channel count. The ALab™ Accurate 96 Real-Time PCR System is a 96-well format instrument offered with 4 or 6 channels, and the Accurate 16-T has 16 wells for 0.2 mL single tubes or 8-strip tubes, with 2 or 4 channels. Well count matters for planning: a standard curve, its replicates and the no-template controls all take wells before the first unknown sample is loaded.
4. PCR and Gel Electrophoresis: Agarose Gels for DNA
PCR and gel electrophoresis meet at the agarose gel. DNA carries a negative charge and migrates towards the positive electrode, the anode. Smaller fragments generally travel farther than larger fragments [3]. Gel percentage, ladder selection, loading and buffer choice affect separation. TAE and TBE are common running buffers, with Tris as the main cation [15]. The stain then determines the viewing step in §7.
Detailed gel-percentage selection, ladder choice and casting are covered in Agarose Gel Percentage and DNA Fragment Size: Choosing and Running a Horizontal Gel.
Tank size. Horizontal tanks are sized by the gel tray. A small tank such as the ALab™ DL-SUB01 Horizontal Electrophoresis Tank takes a 60 × 75 mm gel and uses a dedicated telescopic gel caster. The DL-SUB02 and DL-SUB03 support gel formats up to 120 × 120 mm and 130 × 200 mm, respectively. A larger gel takes more lanes or a longer run path; it also needs more buffer and more time to cast and stain.
5. A Separate Protein Track: SDS-PAGE and Western Transfer
Protein work follows a separate path. In SDS-PAGE, denatured proteins are coated with SDS and separated mainly by size in a discontinuous stacking/resolving gel system associated with Laemmli [16]. Western transfer moves the separated proteins to a membrane for antibody detection [17]; in a transfer tank, an electric field drives the proteins out of the gel and onto the membrane [17][18]. Sample preparation may include heating in SDS buffer, but the appropriate denaturation conditions depend on the sample and protocol; see Dry Baths, Thermo Mixers and Cooling Blocks: Temperature Control for Tubes and Plates. Detailed gel formats and tank-transfer workflow are covered in SDS-PAGE and Western Blot Transfer: Vertical Gels and Wet-Tank Transfer.
The ALab™ DL-ZY02 Transfer Electrophoresis Tank has a 110 × 90 mm transfer area and holds two 83 × 73 mm gels; both the DL-ZY03 and DL-ZY04 have a built-in blue cooling unit, and the DL-ZY04 holds four 83 × 73 mm gels.
A different, older format is acetate membrane electrophoresis, in which a cellulose acetate strip, rather than a gel, is the separation support. The DL-1B Acetate Membrane Electrophoresis Tank is designed for this format, and its bridge sizes appear in Table 2 (§8).
6. Powering the Gel: Constant Voltage, Current or Power
The power step is shared by both tracks: the agarose gel in §4 and the SDS-PAGE gel and tank transfer in §5 all run from an electrophoresis power supply. Electrophoresis settings affect migration and heating. Field strength is voltage divided by the electrode-to-electrode distance, not gel length [3]. Calculated illustration, not a specification. Inputs are hypothetical, not a recommended setting and not an ALab specification: at 20 cm electrode spacing, 5 V/cm requires 100 V; the same 100 V across 10 cm gives 10 V/cm. Uneven heating can distort bands [9]. Constant-voltage, constant-current and constant-power behaviour, together with Joule heating, are covered in Electrophoresis Power Supply Settings: Constant Voltage, Current or Power and Joule Heating.
The ALab™ DEP-300/DEP-600/DEP-300HC Electrophoresis Power Supplies offer constant voltage, constant current and constant power modes, continuously adjustable. Their maxima are specified separately for each model: DEP-300 0–300 V, 0–600 mA and 0–150 W; DEP-600 0–600 V, 0–600 mA and 0–360 W; DEP-300HC 0–300 V, 0–3000 mA and 0–400 W. Each maximum is a separate limit and should not be read as an operating point reached together with the other two.
7. Gel Viewing: Blue Light vs UV, and a Separate Camera
The stain's excitation spectrum determines whether UV or blue-light viewing is appropriate [10][19]. UV exposure can damage DNA intended for downstream work [20], while blue light avoids UV exposure but is not hazard-free, so appropriate filtering and eye-protection practices remain important [21]. Viewing and documentation are separate: a viewer is for inspection, while a camera creates a saved record [10]. Wavelength-specific stain matching and exposure trade-offs are covered in Blue-Light vs UV Transilluminators for Modern DNA Stains.
The ALab™ TI470 Blue Light Transilluminator uses a bottom built-in LED light module with a max emission wavelength of 470 nm and an amber filter cover, and is intended for dyes with an excitation wavelength of 450–495 nm.
8. Molecular Biology Lab Equipment at Each Step
The two tables below map the molecular biology lab equipment in this guide to the step it serves: Table 1 for the nucleic-acid track and Table 2 for the protein track. — = not specified. Electrode distance is given for reference only and is not a ranking.
Table 1. Nucleic-acid track: extraction to gel viewing
| Step | Model | Sample / gel format | Key specification | Size |
|---|---|---|---|---|
| Extraction | MNE-96-03 | 1–96 samples (selectable) | 50–1000 µL processing volume | — |
| PCR | TC1000-G-Pro | 96 × 0.2 mL tubes; 12 × 0.2 mL 8-strips; 1 × 0.2 mL 96-well PCR plate (1 × 96 module) | gradient 30–105 °C; span 1–42 °C | 296 × 370 × 295 mm |
| PCR | TC1000-S+ | as TC1000-G-Pro | non-gradient model | 296 × 370 × 295 mm |
| PCR | TC2000-G1 | 96 × 0.2 mL tubes; 12 × 8-strips; 1 × 0.2 mL 96-well PCR plate (1 × 96 module) | gradient 30–105 °C; span 1–42 °C | 310 × 422 × 264 mm |
| PCR | TC2000-G2 | 0.2 mL tubes and 8-strips (2 × 48 modules) | gradient 30–105 °C; span 1–25 °C | 310 × 422 × 264 mm |
| PCR | TC2000-G3 | 0.2 mL tubes and 8-strips (3 × 32 modules) | gradient 30–105 °C; span 1–25 °C | 310 × 422 × 264 mm |
| qPCR | Accurate 16-T | 16 wells; 0.2 mL single tubes or 8-strip tubes | 2 or 4 channels | 225 × 270 × 132 mm |
| qPCR | Accurate 96 | 96-well format | 4 or 6 channels | — |
| Agarose gel | DL-SUB01 | 60 × 75 mm gel | buffer 300 mL | — |
| Agarose gel | DL-SUB02 | 120 × 120, 120 × 60, 60 × 120 or 60 × 60 mm gels | buffer 700 mL | — |
| Agarose gel | DL-SUB03 | 130 × 200 or 130 × 150 mm gels; combs 1.0 mm: 14, 18, 26 wells; 1.5 mm: 18 wells | buffer 800 mL | — |
| Power | DEP-300 / DEP-600 / DEP-300HC | constant voltage, current or power | DEP-300: 0–300 V, 0–600 mA, 0–150 W; DEP-600: 0–600 V, 0–600 mA, 0–360 W; DEP-300HC: 0–300 V, 0–3000 mA, 0–400 W | 310 × 260 × 115 mm |
| Gel viewing | TI470 | observation area 210 × 120 mm | max emission wavelength 470 nm; amber filter cover | 265 × 195 × 30 mm |
Table 2. Protein track: vertical gels, tank transfer and acetate strips
| Step | Model | Gel / membrane format | Gels per run | Electrodes / cooling | Size |
|---|---|---|---|---|---|
| SDS-PAGE | DL-Mini01 | 8.3 × 7.3 cm gels; 0.75, 1.0 or 1.5 mm (optional) | two | — | — |
| SDS-PAGE | DL-MINI04 | hand-cast 8.3 × 7.3 cm or precast 8.6 × 6.8 cm gels; 1.0 mm default | — | — | — |
| Tank transfer | DL-ZY02 | transfer area 110 × 90 mm | two 83 × 73 mm | electrode spacing 4 cm; one ice cooling unit and two blue cooling units in the standard configuration | — |
| Tank transfer | DL-ZY03 | transfer area 110 × 90 mm | two 83 × 73 mm | electrode spacing 4 cm; built-in blue cooling unit | — |
| Tank transfer | DL-ZY04 | — | four 83 × 73 mm | electrode spacing 5.5 cm; built-in blue cooling unit | — |
| Acetate strip | DL-1B | acetate membrane strips; single bridge 66 × 250 or 82 × 250 mm | — | — | 318 × 175 × 65 mm |
View product / request a quote: select a linked model code in either table to open its product page and view the available quotation options. Configurations are confirmed at quotation.
9. Frequently Asked Questions
How do PCR and gel electrophoresis fit together?
PCR makes many copies of one DNA fragment; the gel then shows whether the reaction gave one product of the expected size. One sharp band suggests a specific reaction, while a ladder of bands or a smear points to non-specific priming [2][3] (§2, §4).
Should I quantify DNA before PCR?
Yes, where you can. A quick absorbance check shows whether the extract is in a workable range and flags protein or salt carry-over, which helps explain a weak or failed PCR before you change the cycling (§1).
Do I still need a gel after qPCR?
Not always. A melt curve can often tell the wanted product from primer-dimer or other products, but a gel is worth running when an assay is new, when the melt curve shows more than one peak or when the product size needs checking [8] (§3).
Constant voltage or constant current for an agarose gel?
Constant voltage is the usual choice for agarose gels, because it keeps the field strength fixed. Set the voltage from the distance between the electrodes, not the gel length [3][9] (§6).
Blue light or UV for my gel stain?
It depends on where the stain absorbs. Stains with strong blue absorption suit a blue-light viewer, which also avoids exposing bands that will be cut out for cloning to UV; stains excited mainly by UV are viewed on a UV source [10][19][20] (§7).
10. Keep Exploring the Molecular Biology Hub
- DNA and Protein Quantification by UV Absorbance: The A260/A280 Ratio, A260/A230 and Purity Checks
- Gradient PCR: Finding the Optimal Annealing Temperature
- qPCR Basics: Ct Values, Standard Curves and Amplification Efficiency
- Agarose Gel Percentage and DNA Fragment Size: Choosing and Running a Horizontal Gel
- Electrophoresis Power Supply Settings: Constant Voltage, Current or Power and Joule Heating
- SDS-PAGE and Western Blot Transfer: Vertical Gels and Wet-Tank Transfer
- Blue-Light vs UV Transilluminators for Modern DNA Stains
- Magnetic-Bead Nucleic Acid Extraction: How Automated Extractors Work
- Dry Baths, Thermo Mixers and Cooling Blocks: Temperature Control for Tubes and Plates