
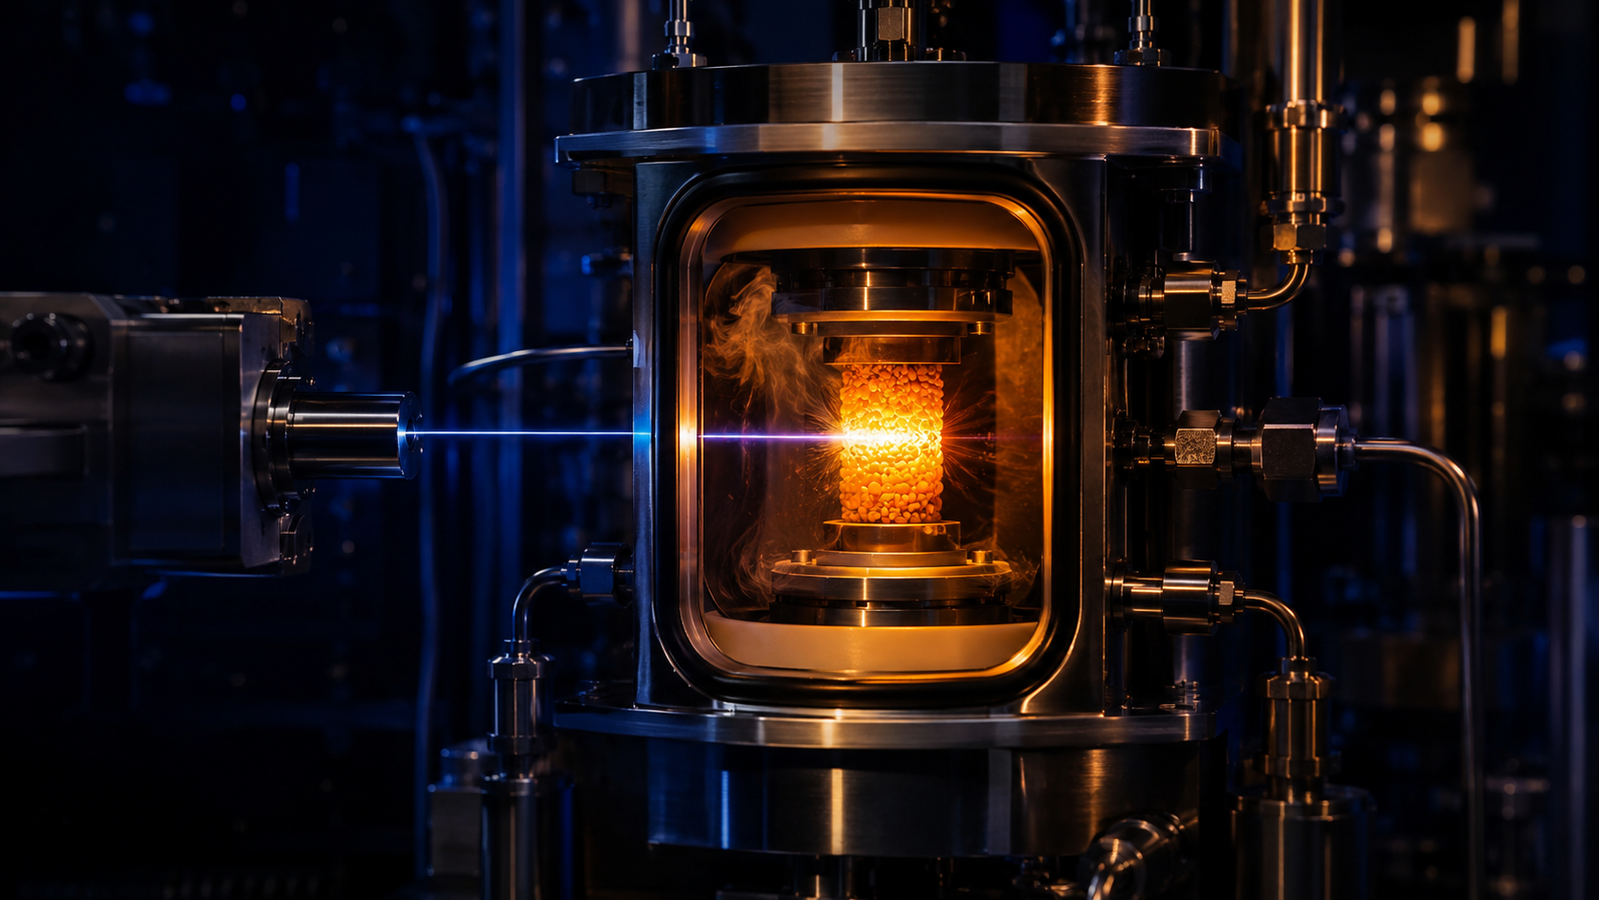
A catalyst studied on the bench is a portrait of an athlete asleep. The catalytically active state — the one doing the chemistry — may exist only, or may differ substantially, under reaction conditions: hot, bathed in feed gas, reshaping itself as conversion proceeds. Take away the gas and the temperature, and the surface relaxes into something else; measure only that, and you may be characterizing a different material from the one that does the chemistry — ex-situ analysis stays complementary for composition and highest-resolution work. In-situ catalysis is the discipline built on this single, hard-won insight: put the catalyst in a heated reaction cell, flow the gas, and interrogate the working state — by microscopy, Raman, or X-ray diffraction — ideally while the products stream past a detector to prove the athlete is actually running. This article maps the field: why resting-state characterization misleads, what each probe sees inside a reaction cell, the light-off curve every practitioner lives by, and the cell-design craft that makes it all honest.
1. Why the Resting State Can Mislead
Catalysts are dynamic by profession. Under reaction gas at temperature, supported metal particles restructure, oxides change oxidation state, surfaces populate with the intermediates of the chemistry they run — and every one of these working features can vanish on cooling and air exposure. The field learned this by direct observation: environmental electron microscopy has watched individual nanoparticles oscillate between shapes under reaction conditions, in rhythm with the reaction itself — dynamics with no resting-state counterpart whatsoever1. The methodological response crystallized around the turn of the millennium: combine structural probes with reaction conditions, and where possible with simultaneous activity measurement — the program articulated in the founding operando literature of catalysis, from combined XRD/XAS studies under working conditions2 to the operando-spectroscopy manifesto that named the methodology3. The stage-and-cell hardware this hub describes is that program’s laboratory embodiment.
2. What Each Probe Sees Inside the Cell
X-ray diffraction reads the crystalline bulk: phase transformations of active components under reducing or oxidizing feeds, particle sintering as reflections sharpen, lattice responses to gas environment — the workhorse view, served by a mature in-situ XRD tradition for oxide and metal catalysts4 and reaching back to the field’s founding dynamic-diffraction demonstrations5. Local-structure extensions of the diffraction experiment probe even nanocrystalline and disordered states as they evolve under gas6. Raman spectroscopy reads bonds and surface phases: oxide species, carbon deposits (coking has a famous Raman signature), and adsorbate-level chemistry — the operando-Raman program in its element3, with the laser-heating caution of this hub’s Raman chapter turned up for dark, absorbing catalyst beds. Optical microscopy reads morphology at the particle-bed scale: color changes of redox state, sintering, and the ignition-front phenomena of exothermic reactions. Each probe is partial; the multi-probe logic of the operando & correlative chapter applies to catalysis with full force.
3. The Light-Off Curve: The Field’s Signature Plot
Plot conversion against temperature for a catalytic reaction and you get the field’s signature: a lazy floor at low temperature, a steep rise as the thermally activated chemistry switches on, and a plateau as conversion saturates — the light-off curve, summarized by its half-conversion temperature T50. The curve is a catalyst’s résumé in one line: a lower T50 means the same job done colder, and comparing curves across formulations, pretreatments, or aging states is the everyday business of catalyst development. It is also the natural meeting point of this hub’s two halves — the temperature axis a stage controls, and the chemistry a reaction cell enables — because measuring a light-off curve is a temperature program: a slow, stability-disciplined ramp under steady feed, with conversion tracked continuously downstream. Where structure is probed simultaneously, the payoff doubles: structural transitions can be located on the light-off curve, tying the moment the catalyst changes to the moment its activity does. A lower T₅₀ marks earlier light-off only when feed composition, flow or GHSV, catalyst mass, conversion definition, selectivity basis, thermal history, mass-transfer regime and stability are matched — one figure of merit, not a verdict on overall quality.
4. Interactive: The Light-Off Lab
The simulator below puts Section 3 on a slider. Sweep the temperature and watch conversion climb the light-off curve; switch between three schematic catalysts to see how a shifted T50 and a changed steepness rewrite the whole operating picture.
Two teaching points ride the curve. The rise is steep because the underlying kinetics are exponential in temperature — a few tens of degrees separate “asleep” from “done” — which is why stage stability and slow-ramp fidelity matter so much near T50. And the comparison across the three presets is the daily logic of catalyst screening: the earlier-light-off formulation has the lower T₅₀ under matched conditions — and overall catalyst quality still requires selectivity, stability and transport checks. The curves are schematic sigmoids with teaching parameters, not data for any real catalyst or reaction.
5. Local Structure & the Nanocatalyst Problem
Bulk-sensitive diffraction has a blind spot exactly where modern catalysis lives: the smallest, most active particles. As crystallites shrink toward a few nanometers, Bragg reflections broaden into the background, and the very states most worth watching — sub-critical clusters, disordered overlayers, amorphous intermediates — can be nearly invisible to conventional pattern analysis. The field’s answer is total-scattering and pair-distribution-function (PDF) analysis: use all of the scattered intensity, diffuse included, and transform it into a real-space map of interatomic distances that reads local structure whether or not long-range order exists. The methodological breakthrough was making this fast enough for in-situ work — rapid-acquisition PDF collapsed measurement times from hours toward seconds and turned local structure into a watchable variable7.
Applied to working catalysts, the technique’s dividends are exactly the invisible states: nanoparticle formation followed from precursor through cluster to crystallite, disorder–order transitions under reducing feeds, the restructuring of supported phases that pattern-based analysis registers only as a vague background shift — the catalysis-under-conditions program that in-situ PDF studies established6. For the laboratory practitioner the takeaway is strategic rather than instrumental: know which structural regime your catalyst occupies. Well-crystallized phases above a few nanometers are conventional in-situ XRD’s home turf, and the workhorse methods of this article serve fully4; deeply nanoscale or disorder-dominated systems are PDF territory, typically a beamline campaign — and recognizing the boundary before designing the experiment saves months of interrogating the wrong observable.
6. Closing the Loop: Operando
The gap between “in-situ” and “operando” in catalysis is a gas line to an analyzer. In-situ work documents the applied temperature and feed when those quantities are measured and validated; operando work additionally measures what the feed became — conversion and selectivity from the effluent, recorded on the same clock as the structural probe3. The dividend is causal proximity: when a diffraction pattern shows a phase appearing at 280 °C and the effluent shows conversion igniting at 280 °C, the association is measured, not assumed — the logic the founding combined-technique studies established2 and the broader operando-methods literature has since systematized across probes8. The correlative chapter’s caution travels here intact: coincidence on one clock strengthens an assignment and narrows mechanism; controls, perturbations and reproducibility still carry the causal weight.
7. Reaction-Cell Craft
The cell is where honesty is won or lost, and the craft has accumulated hard rules. Flow, not stagnation: a sealed static atmosphere depletes reactants and accumulates products; most realistic gas–solid catalysis calls for through-flow at controlled rates (batch and static cells keep their own legitimate uses). Thermal truth: catalyst beds run their own thermal lives — exothermic reactions self-heat, and the bed temperature can exceed the setpoint precisely when chemistry ignites; specimen- or bed-adjacent sensing is required when a quantitative catalyst-bed temperature is claimed, and the calibration chain anchors whatever the sensor claims9. Window chemistry: the window must survive the feed at temperature and stay transparent as the experiment deposits things on it. Bed geometry: beam-friendly thin beds trade against reactor-realistic thick ones — the representativeness negotiation every operando cell design records, and the reason purpose-built multi-environment cells and laboratory operando geometries are a literature of their own1011. Time resolution joins the list when kinetics are fast: modern beamline programs resolve working catalysts at seconds and below1213; laboratory cadences suit slower chemistry and long campaigns.
8. Beam Effects & the Probe Tax
Every probe taxes the sample it interrogates, and catalysis collects the tax at unusually high rates because catalyst beds are engineered to be dark, absorbing and reactive. The Raman laser leads the audit. A focused visible laser on a black oxide or carbon-laden bed is a micro-heater; local temperatures at the spot can run far above the platform reading, shifting apparent phase behaviour and even driving spurious reactions in the illuminated volume. The defense is the power series — halve the laser power until the spectrum stops changing, then work below that threshold — plus dose-spreading tactics and the standing habit of treating any power-dependent feature as probe-induced until proven otherwise. Electron and X-ray beams file alongside: beam-induced chemistry, charging and damage are quantified realities of electron microscopy with their own protective canon14, and intense synchrotron beams can drive radiolysis and local heating in gas-filled cells.
The probe tax has a catalysis-specific twist worth naming: the probe can perturb not only the sample but the reaction — a locally heated spot in an exothermic bed can nucleate ignition, converting a measurement artifact into a genuine (but unrepresentative) chemical event. The operando literature’s response is procedural honesty: beam-on/beam-off comparisons, power-and-flux series reported alongside results, replicate spots to distinguish local damage from global chemistry, and explicit statement of probe conditions as part of the experimental record8. None of this diminishes the methods — it locates them: an in-situ result is a sample-plus-environment-plus-probe system, and mature practice keeps all three terms in the report.
9. The Error Budget
Bed self-heating leads: exothermic ignition can carry the bed far above the controller’s belief, and the error is largest exactly at the interesting moment — sense in or at the bed, and treat light-off temperatures without bed sensing as provisional. Gradients across the bed: front-to-back conversion gradients mean the beam may probe a different chemical environment than the effluent reports; thin beds and differential-conversion operation are the classical mitigations. Probe perturbation: the Raman laser heats dark beds; beam effects act on sensitive phases — power series and on/off checks are the standard tax8. Window and background drift: deposits change transmission and scattering mid-experiment; monitor and correct. Deactivation during measurement: the catalyst ages while you watch — which is either a confound or, treated deliberately, the experiment itself.
10. Deactivation Watched Live
The error budget’s last entry — the catalyst ages while you watch — deserves promotion from confound to experiment, because deactivation is where in-situ methods repay their cost most directly. The three classic mechanisms each carry a live signature. Sintering: active particles coarsen at temperature, and diffraction watches it as reflections sharpening in real time — crystallite growth read from peak width, hour by hour, under the actual feed, once strain relaxation, ordering and instrumental drift are excluded as alternatives4. Coking: carbon lays down on the working surface, and Raman sees it arrive — the carbon bands growing over the catalyst’s own spectrum, a semi-quantitative accumulation curve (material-specific calibration turns it quantitative) recorded without ever opening the cell3. Poisoning and phase loss: active phases convert to inactive ones under contaminants or excursions, and the pattern sequence documents which phase died and when.
The operando pairing turns separate observations into a time-aligned mechanistic test: activity decays on the same clock, so the question “is the deactivation we measure the sintering we see?” becomes answerable — correlate the conversion trace against the width narrowing, the carbon-band growth, the phase fractions — cross-channel timing narrows the plausible mechanism, while controls and complementary evidence still carry the conviction. Regeneration closes the loop: burn off the coke or redisperse the metal in an oxidizing excursion and watch both the structural signature reverse and the activity return — or fail to, which is equally diagnostic. Deactivation studies are, in this sense, the purest expression of the whole chapter: slow, unglamorous, industrially decisive chemistry that endpoint characterization can only autopsy — and that a stage, a cell and patience convert into mechanism.
11. From Lab to Beamline: Choosing Your Cadence
The final design axis is cadence: how fast must you look, and where can you afford to look that fast? Laboratory instruments — the stage-plus-diffractometer, stage-plus-Raman and stage-plus-microscope benches of this hub — sample on cadences of seconds to minutes per point, which suits an enormous share of real catalysis: light-off mapping under slow ramps, deactivation and coking studies across hours, regeneration cycles, formulation screening. Their structural advantages are availability and iteration — the experiment you can repeat weekly beats the perfect experiment you can run yearly — and the methodological tradition of non-ambient diffraction was built and refined precisely on such laboratory hardware15.
Beamline campaigns buy what the laboratory cannot: high flux supports shorter exposures, while tunable or high photon energy and beamline optics govern penetration and geometry. Modern synchrotron programs resolve working catalysts on sub-second cadences, follow fast transients through realistic cell walls, and pair diffraction with simultaneous spectroscopies on one clock12 — with data pipelines engineered for the resulting torrents13. The mature program uses the two tiers as stages of one workflow: laboratory campaigns to map the phase landscape, locate the interesting conditions and burn down hypotheses cheaply; beamline time — proposed with that map in hand — spent exclusively on the fast, the thick and the simultaneous. Cadence, in other words, is not a virtue to maximize but a resource to allocate; the light-off curve does not care where it was measured, only that the temperature axis under it was honest.
12. Hardware Notes
The catalysis bench composes this hub’s standard elements around a gas-capable core: a heated stage with a compatible reaction-cell or gas-flow configuration — available sealing, flow, pressure, exhaust and gas-safety capabilities are model- and quotation-specific within the InSitu Pro™ family — paired with the instrument of your probe: optical microscopy per the hot-stage chapter, Raman per the variable-temperature Raman guide, diffraction per the in-situ XRD guide. Gas-handling (mass-flow control, manifolds, effluent routing to your analyzer) and reaction-cell specifics — bed geometry, window materials, temperature sensing at the bed — are experiment-specific and confirmed at quotation; the selection guide and stage selector are the fastest route into that conversation.
13. FAQ: In-Situ Catalysis
14. Keep Exploring the InSitu Pro™ Knowledge Hub
This article is the reactive-atmosphere frontier of the InSitu Pro™ knowledge hub. To keep going:
- Non-ambient characterization — the temperature/atmosphere/vacuum foundations under this chapter.
- Operando & correlative microscopy — the multi-probe methodology catalysis exemplifies.
- In-situ XRD — the diffraction probe in depth.
- Variable-temperature Raman — the vibrational probe, laser discipline included.
- In-situ oxidation studies — gas–solid kinetics, the optical way.
- How to choose an in-situ stage — from reaction to configuration; or use the stage selector.
References
This article discusses in-situ and operando catalysis characterization in general terms. Reaction conditions, cell behaviours, bed thermal effects and probe interactions are chemistry-, hardware- and configuration-specific; validate against the published literature, applicable safety practices and your own measurements before quantitative use. The interactive simulator presents schematic sigmoid light-off curves with teaching parameters, not data for any real catalyst. Reaction-cell configurations, gas handling and atmosphere options are experiment-specific; contact ACS Material to discuss options for your application.