
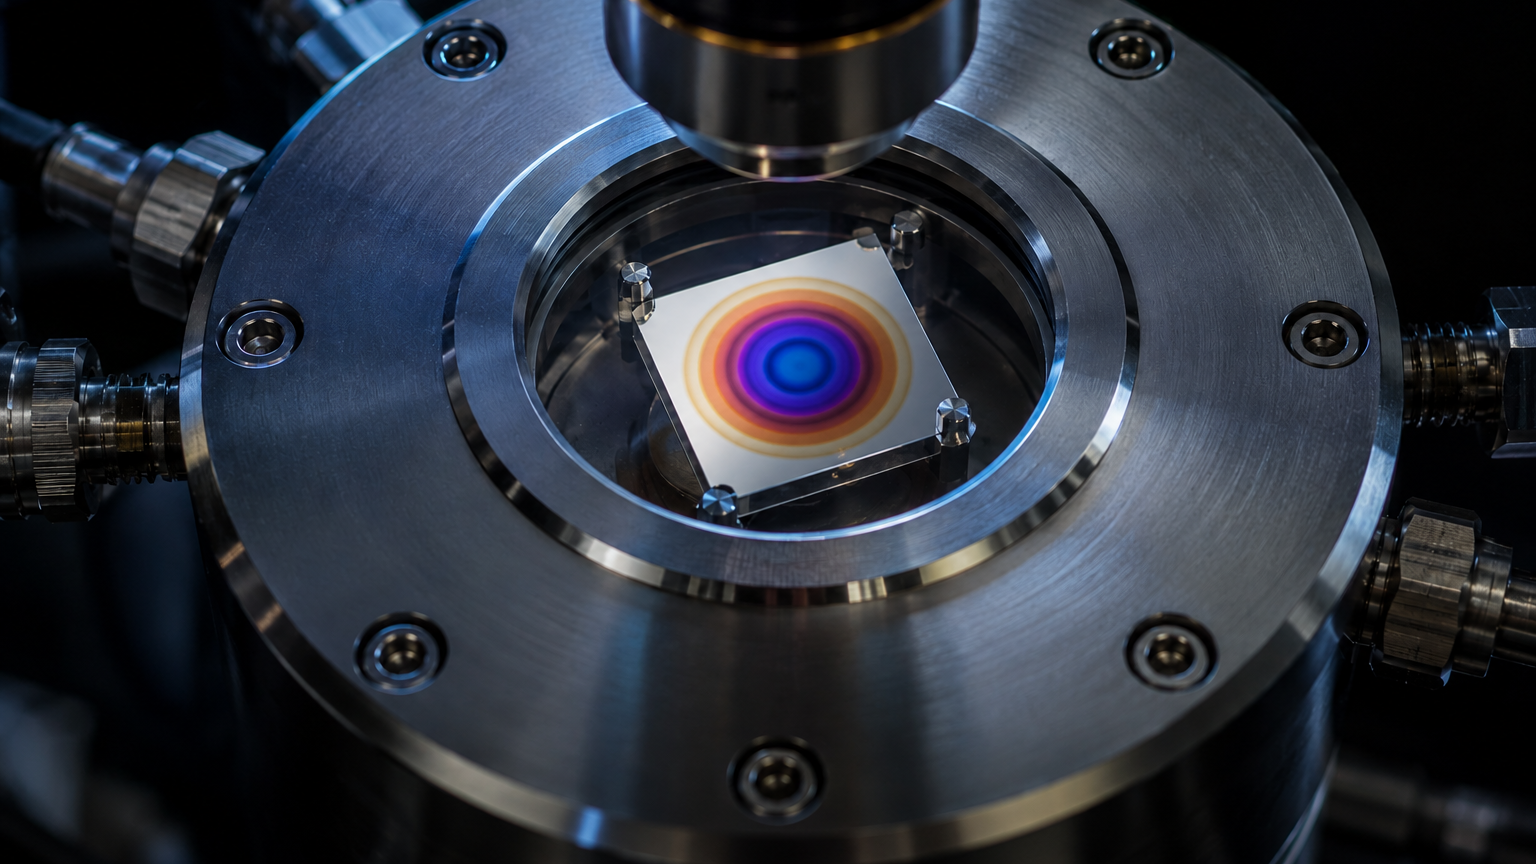
Most characterization tells you what a sample was. An in-situ oxidation study tells you what it is doing — because oxidation, almost uniquely among solid-state reactions, announces itself in visible light. A titanium coupon slides from silver through straw, purple and blue as its oxide thickens. A copper film blushes red with Cu2O, then goes black as CuO takes over. Steel walks through the classic temper colours that generations of machinists have read as a thermometer. Put the sample on a sealed optical heating stage, control the gas around it, and an ordinary reflected-light microscope becomes a real-time oxidation instrument: the colour is the data. This guide explains the thermodynamics and kinetics behind what you see, how interference turns colour into a thickness gauge, what each common metal actually looks like as it oxidizes, and how to run — or deliberately suppress — an oxidation experiment on an in-situ optical stage.
1. Oxidation Is an Experiment You Can Watch
Oxidation research has a long tradition of working backwards. A coupon goes into a furnace, comes out after a set time, and is weighed, sectioned and imaged — then the experiment is repeated at other times and temperatures until a kinetic curve emerges point by point. It works, but every point is a different sample, every quench is a perturbation, and everything that happened between the points is invisible.
In-situ methods collapse that whole campaign into one continuous observation. At the atomic-scale extreme, ultra-high-vacuum transmission electron microscopy has directly visualized the very first Cu2O islands nucleating and growing on clean copper surfaces, revealing that oxygen surface diffusion — not uniform layer-by-layer coverage — dominates the earliest stage of oxidation1. At the laboratory scale, the same philosophy needs nothing more exotic than light: transmission-mode absorbance through an oxidizing copper film tracks its conversion in real time and resolves a clean parabolic rate law with an Arrhenius temperature dependence2, and combined real-time X-ray diffraction and resistance measurements on heated Cu films have mapped exactly when Cu2O forms, how fast it grows, and the moment CuO finally appears3.
An optical heating stage sits in the most accessible part of that spectrum. The sample lies in a small sealed chamber with a transparent window, a controlled gas environment and a programmable heater, under a normal reflected-light microscope. No synchrotron, no electron column — yet because oxide films modulate reflected light so strongly, the microscope sees nucleation as spreading patches, growth as a marching colour sequence, and scale failure as sudden local colour resets. The rest of this article is about turning those observations into numbers.
2. The Thermodynamic Verdict: Almost Everything Wants to Oxidize
The first question in any oxidation study — will this metal oxidize? — has an unhelpfully uniform answer. For nearly every engineering metal, the free-energy change for forming the oxide from metal and oxygen is strongly negative across the whole temperature range an in-situ stage can reach. Ranked on the classic free-energy-versus-temperature (Ellingham-type) diagrams of oxide stability, the common structural metals — iron, copper, nickel, titanium, aluminium — and silicon all sit comfortably on the “oxide is stable” side in air; among the elements, essentially only the noble metals escape4. Thermodynamics rarely says no. One caution before moving on: equilibrium diagrams identify which oxide phases are thermodynamically allowed under given conditions — the phases you actually observe can differ, because nucleation, diffusion, metastability and finite experimental time control the pathway.
That is exactly why the interesting question is the second one: how fast? The difference between a titanium implant that survives decades in air and a titanium powder that burns is not the sign of ΔG — it is identical — but the transport kinetics through the oxide that forms. Thermodynamics sets the destination; the oxide layer itself sets the speed limit. Equilibrium diagrams still earn their keep in one practical way, though: they tell you which oxide phase to expect at a given temperature and oxygen pressure, and how aggressively you must strip oxygen from the atmosphere before a given metal genuinely stops reacting — a bar that is punishingly high for reactive metals like titanium and essentially unreachable for aluminium in any real gas4.
3. Oxidation Kinetics: Three Limiting Models of Oxide Growth
Watch oxide thickness grow against time on a stage and, depending on temperature, film thickness and the rate-limiting step, the curve you record will usually resemble one of three canonical limiting models. They are useful descriptions, not a universal three-step sequence: a real curve can transition between laws, mix several transport processes, or depart from all three when the film cracks, volatilizes or changes phase — titanium’s drift through logarithmic, cubic and parabolic behaviour in Section 6 is the classic example.
Very thin films, modest temperatures: the Cabrera–Mott regime. When the oxide is only a few nanometres thick, electrons can tunnel through it to ionize adsorbed oxygen, setting up an electric field across the film strong enough to drag metal ions through at temperatures where ordinary diffusion would be hopeless. The result, worked out by Cabrera and Mott in 1949, is extremely fast initial growth that decelerates savagely — an inverse-logarithmic law — so the film races to a few nanometres and then, at low temperature, effectively stops at a limiting thickness5. This is why polished metals at room temperature carry a stable native oxide a few nanometres thick instead of rusting away. Cabrera–Mott-type behaviour best describes the earliest growth of very thin oxides on clean or lightly oxidized surfaces at modest temperatures; a sample that arrives with a thicker film, a passive layer or a loaded surface history starts further along the curve.
Thick films, high temperatures: the Wagner parabolic regime. Once the film is thick enough that the field-assisted mechanism fades, growth is limited by solid-state diffusion of ions through the scale. Wagner's 1933 analysis showed that when transport through the growing layer is rate-limiting, thickness obeys the parabolic law x² = kpt: each new increment of oxide lengthens the diffusion path for the next6. The parabolic rate constant is thermally activated, kp = k0 exp(−Ea/RT), which is why modest temperature steps change growth rates enormously — for copper, careful measurements across 350–1050 °C give parabolic kinetics throughout, with an activation energy of about 173 kJ/mol in the lattice-diffusion regime7. Atkinson's authoritative review adds the crucial real-world refinement: in fine-grained scales at intermediate temperatures, diffusion along oxide grain boundaries, not through the lattice, usually carries most of the traffic, lowering the effective activation energy without changing the parabolic form8.
Interface-limited growth: the linear regime. If transport through the film is easy but a surface or interface reaction is slow — oxygen dissociation on the oxide surface, reaction at the metal–oxide interface, or transport through a cracked, non-protective scale — thickness simply grows in proportion to time. The cleanest modern example is again copper: real-time measurements on thin films at 100–300 °C show Cu→Cu2O conversion following a linear rate law controlled by the oxygen dissociation step at the gas–solid interface3. The two limits also combine gracefully: Deal and Grove's celebrated linear–parabolic model for silicon oxidation, x² + Ax = B(t + τ), captures interface control while the oxide is thin and diffusion control once it thickens, and fits SiO2 growth over 700–1300 °C in both dry and wet oxygen9.
On a stage, the practical use of these laws is diagnostic. Convert your colour record into thickness (the next two sections show how), plot it against time, and the shape hands you a first mechanistic clue — not a proof: decelerating-then-frozen is consistent with Cabrera–Mott, a straight line on x²-versus-t with diffusion control, a straight line on x-versus-t with an interface bottleneck — and an abrupt kink upward usually means your protective scale just failed (Section 7). Before calling it a mechanism, combine the fitted law with phase identification, oxygen-partial-pressure dependence, an activation energy and an independent thickness or mass-gain check.
| Rate law | Form | Consistent with | Main caution |
|---|---|---|---|
| Logarithmic / inverse-log | x ∝ log t (and variants) | Field-assisted growth of very thin films (Cabrera–Mott regime) | Limited to the first nanometres; several variants can fit equally well |
| Linear | x = klt | Interface-reaction control or a non-protective scale | Also produced by cracking, spallation or continuous oxidant access |
| Parabolic | x² = kpt | Diffusion through a protective scale (Wagner) | Does not identify which species diffuses |
| Cubic | x³ = kct | Certain thin-film or mixed transport-limited cases | Often empirical and material-specific |
A fitted exponent alone does not establish the microscopic mechanism.
4. Temper Colours & Oxide Thickness: Interference as a Gauge
The colours are not pigments. Most thermally grown oxides on polished metal — TiO2 on titanium, the Cr-rich film on stainless steel, SiO2 on silicon — are transparent or weakly absorbing in the visible. What you see is thin-film interference: light reflected from the top of the oxide interferes with light reflected from the buried metal, and the phase difference between the two depends on the oxide's thickness and refractive index. At any given thickness, some wavelengths interfere destructively and are suppressed in the reflection; the eye integrates what survives and reports a colour. As the film grows, the suppressed band sweeps through the spectrum and the surface marches through a reproducible colour sequence — the machinist's straw–purple–blue on steel, the anodizer's gold–violet–blue–green on titanium.
Because the sequence is set by optics, it can be computed, not just memorized. The standard recipe calculates the full reflected spectrum R(λ) of the air–oxide–metal stack from the Fresnel equations, weights it by the illuminant and the CIE standard-observer colour-matching functions, and converts the result to display RGB — producing calibrated electronic colour charts that map film thickness to perceived colour for any light source and viewing angle10. The same physics runs in reverse as metrology: on titanium — in that study, for anodically grown films — measured reflectance spectra and ellipsometry tie each interference colour to a specific oxide thickness11. After sample-specific calibration, a colour chart therefore becomes a non-contact thickness estimator: semi-quantitative in routine use, approaching nanometre scale only under well-controlled conditions, and always specific to the oxide’s composition and refractive index, the surface finish, the illumination and the camera response.
For in-situ work this is the central gift. Interference converts an ordinary colour camera into a continuous thickness sensor over roughly the first 10–300 nm of growth — precisely the range where the interesting kinetic transitions happen — with three honest caveats. The surface must be reasonably polished, because roughness scrambles the interference. The reading is only as good as the assumed refractive index, which varies with oxide phase and density. And strongly absorbing oxides (copper's, notably) colour the surface by absorption rather than clean interference, so their optical record is qualitative rather than a nanometre ruler.
5. Interactive: Temper Colours & Oxide Growth
The model below puts the last two sections in one place. Choose a substrate — polished stainless steel or titanium — then set a hold temperature and time. The model grows an oxide film using a parabolic law with an Arrhenius rate constant, computes the exact thin-film reflection spectrum of the resulting air–oxide–metal stack, and renders the colour your eye would see, alongside the full thickness–colour band so you can locate the reading on the temper-colour sequence. Slide the temperature up by fifty degrees and watch how disproportionately the film — and the colour — responds: that is Arrhenius kinetics made visible.
Two parts of the model deserve an honest label. The colour physics is exact for its idealization: normal-incidence Fresnel reflection of an air / transparent-oxide / metal stack, integrated over the visible spectrum with the CIE 1931 standard observer under a D65 illuminant — the same construction used to build published colour charts for films on silicon10 — using representative optical constants (oxide index ≈ 2.35–2.4; metal treated as a complex-index reflector) held constant across wavelength. The growth model is deliberately pedagogical: it uses d = √(kpt) with effective activation energies (≈40 kJ/mol for the steel band, ≈60 kJ/mol for titanium) calibrated so the output lands on the familiar temper-colour charts — not literature lattice-diffusion values. Real growth in this thin, low-temperature regime is Cabrera–Mott-like rather than truly parabolic5, and real rate constants depend on alloy, surface finish and atmosphere8; treat the simulator as a teaching interpolation between chart points, and treat published kinetics as the quantitative record. Colours assume a polished surface, a single uniform film and normal incidence.
6. Reading Real Metals: What Each One Shows You
Titanium is the showpiece. Its oxide is transparent, high-index (rutile/anatase TiO2, n ≈ 2.4–2.7), and adherent through the colour-producing range, so the interference sequence is vivid and clean, and colour-to-thickness calibrations are well established11. The classical kinetics behind the colours were mapped by Kofstad, Hauffe and Kjöllesdal, who also quantified titanium's defining complication: a large fraction of the reacted oxygen does not stay in the scale but dissolves into the metal itself, hardening the subsurface12. At stage-reachable temperatures the growth law drifts between logarithmic, cubic and parabolic depending on temperature and film thickness, with high-temperature oxygen-in-oxide diffusion control mapped in Stringer's classic study13. On a stage: expect straw at a few hundred degrees creeping in over minutes, blues and violets as you push toward ~450–500 °C, then second-order greens and pinks, and eventually a matte grey as the scale thickens beyond the interference range.
Iron and carbon steel trade elegance for drama. Above roughly 570 °C iron grows the famous three-layer scale — wüstite (FeO) innermost, magnetite (Fe3O4), then hämatite (Fe2O3) at the gas side — with overall parabolic kinetics dominated by the fast-growing wüstite layer, as consolidated in Chen and Yuen's review14 and in Païdassi's classical measurements of iron in air across 700–1250 °C15. Below that threshold, where an optical stage typically operates, wüstite is unstable and you instead watch the low-temperature story: temper colours first (interference through a thin, mostly Fe2O3/Fe3O4 film), then progressive darkening, and — on carbon steels especially — local blistering and spallation events that appear as sudden bright patches where fresh metal is re-exposed14. Stainless steel adds a twist worth knowing: its colour sequence rides on a Cr-rich film, and the heat tint you can see corresponds to chromium pulled out of the alloy surface beneath, which is why welded stainless with visible tint is treated as locally compromised in corrosion resistance — an oxide-scale-plus-chromium-depletion effect distinct from classical grain-boundary sensitization.
Copper is the kinetics workhorse precisely because its optics are different. Cu2O is a strongly absorbing red-brown semiconductor and CuO is nearly black, so copper's colour record is dominated by absorption — a red-then-black progression — rather than a clean interference ladder. What copper offers instead is the best-documented kinetics in the business: parabolic growth by outward copper diffusion across 350–1050 °C7, linear surface-reaction-controlled Cu→Cu2O conversion at 100–300 °C with a dramatic rate collapse at low oxygen partial pressure3, decades of in-situ ellipsometric growth curves on thin films16 down to sub-monolayer oxygen uptake17, and direct TEM imaging of the island-nucleation stage1. Alloying shifts the whole picture: in Cu–Au films, diluting the reactive component changes incubation times, boosts island nucleation and slows growth — a clean in-situ demonstration that oxidation resistance can be engineered at the nucleation step18.
Silicon is the calibration standard. Its oxidation is slow, uniform and superbly characterized by the Deal–Grove linear–parabolic model9, and because SiO2-on-Si is the canonical interference system, published colour charts make wafer colours a routine thickness check10 — useful both as a teaching sample and as an on-stage sanity check for your own colour-to-thickness reading.
Graphene and 2D materials invert the question: here oxidation does not grow a film, it consumes the sample. In O2 at elevated temperature, graphene oxidation etches the lattice, with kinetics that depend sharply on layer number — single layers react fastest and pit randomly, while three-layer stacks already behave like bulk graphite — and even non-etching oxygen adsorption strongly hole-dopes the sheet19. For anyone heating 2D samples on a stage in air, that is both an experiment (watch etch pits bloom under the microscope) and a warning (Section 10).
| Metal | Oxide(s) in stage range | What you see optically | Dominant kinetics on a stage |
|---|---|---|---|
| Titanium | TiO2 (+ dissolved O in metal) | Vivid interference ladder: straw → purple → blue → second-order colours11 | Log/cubic → parabolic with rising T; oxygen also dissolves into the metal1213 |
| Steel / iron | Fe2O3, Fe3O4 (FeO only >≈570 °C) | Temper colours, then darkening; blisters and bright spallation patches14 | Thin-film interference regime at stage T; classical parabolic multi-layer growth at furnace T15 |
| Copper | Cu2O, then CuO | Absorption colours: red-brown Cu2O deepening to black CuO3 | Linear (surface-reaction) at 100–300 °C; parabolic above7 |
| Silicon | SiO2 | Slow, uniform interference colours; the classic colour-chart system10 | Deal–Grove linear–parabolic; very slow below ~700 °C9 |
| Graphene / 2D | None — lattice is etched | Etch pits and shrinking flakes; contrast loss layer by layer19 | Layer-number-dependent etch kinetics; doping even without etching19 |
7. Protective Scales, Breakaway & What Failure Looks Like
Every kinetic law in Section 3 silently assumes the oxide stays put. Whether it does is largely a mechanics question, and the classic first-order screen is the Pilling–Bedworth ratio — the volume of oxide formed per volume of metal consumed. A ratio below one (magnesium is the textbook case) usually signals too little oxide volume to cover the metal continuously, so growth tends to be porous and non-protective; a ratio moderately above one lets the film form in compression and often seal the surface; a ratio far above one builds enough compressive strain that buckling, cracking or flaking becomes a real risk4. It is a screen, not a verdict — adhesion, plasticity, growth stresses and thermal-expansion mismatch all matter — but it explains the broad families you observe.
The failure mode has a name worth knowing: breakaway oxidation. A protective scale slows growth parabolically until stress or a defect cracks it; oxygen then reaches bare metal through the flaw, growth locally re-accelerates toward linear, the fresh oxide re-stresses the scale, and the cycle repeats4. On a mass-gain curve breakaway is a kink. Under an in-situ microscope it is a spectacle: a colour field that has been maturing smoothly for an hour suddenly develops a bright island of near-bare metal where a flake lifted, and the island then replays the entire colour sequence from the beginning at visibly higher speed. Blistering — the scale detaching and doming before it ruptures, well documented on heated steels14 — shows up first as a local change in reflectivity and interference fringe spacing. These events are precisely the ones post-mortem analysis reconstructs with difficulty and an optical stage records for free, timestamps included.
8. Atmosphere Is the Control Knob
Temperature gets the attention, but on a sealed stage the gas line is an equally powerful axis — and the one that separates an in-situ chamber from a hot plate.
Dry air is the reproducible oxidizing reference for kinetics you intend to measure; pure or enriched O2 raises the oxygen activity further when you want it. Reduced oxygen partial pressure is a genuinely independent variable, not just “slower air”: when the rate-limiting step involves the gas–solid interface, dropping pO2 can collapse the rate dramatically and even change which oxide phase forms, as the copper work shows directly — Cu2O formation slows sharply at low pO2, and CuO appears only under sufficiently oxidizing conditions3. Inert gas (N2 or Ar) is the standard protective choice, with the caveat every high-temperature practitioner learns once: cylinder-grade inert gas still carries parts-per-million oxygen and water, which is far more than a reactive metal needs. Titanium at 600 °C will find every ppm; a slow colour drift toward straw under “pure argon” may be flagging residual oxidation — distinguish it from roughening, illumination or camera drift with a blank run — and gettering or higher-grade gas is the fix4. Vacuum cuts oxygen arrival by orders of magnitude and is the cleanest way to separate thermal effects from oxidation — though never to zero: residual gas, water vapour, chamber outgassing and small leaks remain, and for the most oxygen-hungry metals even that residual flux leaves a slowly thickening film. Reducing atmospheres (typically a few percent H2 in N2 or Ar) go one step further and can reduce oxides that are thermodynamically and kinetically reducible at the chosen temperature and H2/H2O ratio (not a universal eraser for every oxide) — which also makes them a hazard class of their own, requiring a stage and gas handling rated for flammable mixtures.
The disciplined habit is to treat atmosphere as a logged experimental parameter — gas, grade, flow rate, purge time — rather than a checkbox. Many confusing in-situ oxidation results trace back to an atmosphere that was not what its label claimed.
| Atmosphere | Main purpose | Main residual risk | Essential control |
|---|---|---|---|
| Dry air | Reproducible oxidizing reference | Humidity and flow variation | Flow rate, humidity, temperature |
| Pure / enriched O₂ | Higher oxygen activity | Faster, harder-to-quench oxidation | pO₂, flow, safety |
| Inert gas (N₂, Ar) | Suppress or slow oxidation | ppm-level O₂/H₂O, dead volumes, leaks | Gas grade, purge discipline, oxygen monitor |
| Vacuum | Reduce oxygen partial pressure | Outgassing and residual gas | Pressure and residual-gas history |
| H₂-containing mix | Reduction / controlled oxygen potential | Flammability; incomplete reduction | Approved stage and gas handling, dew point, H₂/H₂O ratio |
9. How to Run an In-Situ Oxidation Experiment on an Optical Stage
The hardware requirements map directly onto the physics. You need a chamber whose atmosphere you control and a window over the sample — the configuration of the ACH600S optical heating & cooling stage, whose atmosphere chamber and quartz observation window cover −190–600 °C, the range where nearly all colour-regime oxidation lives; its sibling ACH400SV swaps in a vacuum chamber over −190–400 °C for suppression baselines and clean pump–purge cycles. Controlled-gas, low-oxygen or reactive-atmosphere operation is confirmed for the required gas composition, flow, pressure and safety configuration at quotation. A practical run looks like this:
Prepare the surface like an optics experiment. Interference metrology needs a polished, cleaned, degreased surface prepared by a reproducible, documented procedure — for example, finishing with 1-μm diamond — and, for quantitative colour work, preparation kept identical across samples; that discipline is what turns the colour sequence from a vague sheen into a readable instrument. Record a reference frame at room temperature. Purge deliberately. Establish the atmosphere before heat: several chamber volumes of flowing gas, or pump–backfill cycles on a vacuum-capable stage, then leave a steady flow so the chamber stays at slight positive pressure — keeping flow, pressure and exchange volume within the stage rating, and using reactive or hydrogen-containing gases only in a configuration approved for that service. Ramp with intent. A faster ramp shortens the time spent at intermediate temperatures, but growth during the ramp can still be significant for fast-oxidizing systems — record the full temperature history and fold ramp-stage growth into the analysis when it matters; slow ramps smear growth across a temperature range. For colour work, fixed exposure and white balance matter more than absolute illumination — lock the camera settings for the whole run. Log time-stamped frames at an interval matched to the expected rate: seconds during the first minutes at temperature, stretching later as parabolic growth decelerates. Convert and check. Map colours to thickness with a chart appropriate to your oxide's refractive index1011, plot thickness against time, and identify the regime from the shape (Section 3).
Two honest limits close the protocol. Optical colour reading saturates once the film outgrows the interference range or roughens, at which point mass-gain or electron microscopy takes over. And optics identifies thickness, not crystal phase: if the question is which oxide polymorph is forming and when, that is diffraction's job — the same heated-and-controlled-atmosphere philosophy moves onto a diffractometer with a non-ambient XRD attachment, where X-ray-transparent windows replace the quartz viewport. For what that looks like in practice — crystalline oxide phases appearing and transforming as temperature runs, while optics tracks colour, coverage and morphology — see in-situ XRD: watching crystal structure evolve.
10. When Oxidation Is the Artifact, Not the Experiment
Flip every argument above and you get the second, quieter use of this whole subject: most people running heated in-situ experiments are not studying oxidation — they are being ambushed by it. A melting-point determination on a hot stage where the crystal darkens before it melts; a variable-temperature Raman series where a slowly growing surface film adds background and shifts intensities; a graphene device annealed in air that comes back etched and heavily doped19 — all are oxidation experiments nobody ordered.
The defenses are exactly the knobs of Section 8, applied in reverse: inert purge or vacuum whenever the sample is reactive and the temperature meaningful, purge before the ramp, and mind the gas grade. The colour physics of Section 4 then becomes your tripwire rather than your instrument — any drift in surface colour during a “protected” run means oxygen is getting in, and the drift rate tells you how badly. Where the risk sits for your material and temperature is worth checking before the run rather than after; the same reasoning is built into our heating-stage product pages as an interactive oxidation-risk lookup. For the sibling experiments where oxidation most often intrudes, see the dedicated guides to hot-stage microscopy and variable-temperature Raman spectroscopy, which treat melting, crystallization and spectroscopy on the same stages this article uses for oxidation itself.
11. Choosing a Stage for Oxidation Work
Five questions pin down the configuration:
- Optical Heating & Cooling Stage (ACH600S / ACH400SV) — atmosphere chamber to −190–600 °C (ACH600S) or vacuum chamber to −190–400 °C (ACH400SV), quartz observation window: the platform this article's protocols are written around.
- ACH600S-T / ACH400SV-T ultra-thin variants — the same chambers in the family’s thinnest 21.5 mm body, for tightly space-constrained optical geometries; reflection and transmission paths are available on both standard and ultra-thin configurations with the appropriate windows.
- All InSitu Pro™ optical stages — the full optical-application family, from capillary and XY-mapping variants to Raman-oriented configurations; or let the interactive stage selector match your experiment to a configuration in a few questions.
12. Frequently Asked Questions
13. Keep Exploring the InSitu Pro™ Knowledge Hub
This article is part of the InSitu Pro™ knowledge hub on temperature-controlled, atmosphere-controlled characterization. To keep going:
- In-situ heating, cooling & electrical stages: a theory guide — the pillar article on how temperature-controlled stages work, from heater physics to thermal lag, that underpins every experiment described here.
- Hot-stage microscopy — melting, crystallization and phase transitions under the same optical stages, where oxidation is the artifact to suppress rather than the signal to record.
- Variable-temperature Raman spectroscopy — chemical and vibrational readouts across temperature, with its own oxidation-protection discipline.
- In-situ XRD: watching crystal structure evolve — the diffraction-side complement that identifies which crystalline oxide phases form while optics tracks colour, coverage and morphology.
- How to choose an in-situ heating & cooling stage — the five-step selection guide with interactive simulators, and the stage selector for a quick configuration match.
- Optical Heating & Cooling Stage (ACH600S / ACH400SV) — the product page for the sealed-chamber optical stage this article's protocols are built around.
References
This article discusses in-situ oxidation studies — thermodynamics, kinetics, interference-colour thickness reading and stage practice — in general terms. Oxidation rates, colour–thickness correspondences, activation energies and temperature thresholds are idealized and material-, alloy-, finish- and atmosphere-dependent; real behaviour varies with grade, purity, surface preparation and instrument configuration, and should be confirmed against the published literature, your own calibrations and the manufacturer's datasheets before quantitative use. The interactive simulator is a schematic teaching tool — its colour computation uses idealized single-film optics with representative constants and its growth model uses effective parameters calibrated to temper-colour charts — and is not a substitute for measured kinetics or proper optical metrology.