
A pressed pellet for XRF can fail where you can see it: cracked, crumbling at the edge, rough or shedding powder. It can also fail where you cannot: too thin for the line being measured, ground too coarsely, or carrying elements picked up from the mill. The second kind shows only in the numbers: pellets made from the same powder disagree, or results disagree with a reference material or with fused beads. This guide covers both, and shows how to split the scatter of your results into the part that comes from making the pellet and the part that comes from measuring it.
In one paragraph: fix the visible defects first. In the studies cited here, pellets pressed at a low load cracked, and biological pellets pressed at a conventional pressure shed powder that contaminated the spectrometer. Then check the invisible ones. The pellet must be thicker than the depth the line comes from or, where that is not possible, of known thickness. The grain size must be fine and the same for standards and samples. The grinding vessel must not add the elements you report. Finally, press three or more pellets from one powder and measure each of them two or more times, the same number of times each, in a mixed order. The split shows whether the scatter sits within pellets, where counting and the instrument act, or between them, where the mixing of the powder, weighing and pressing are the first things to test. In one comparison of glass discs, pressed powders and counting errors on reference rocks, preparation errors limited the precision of every method.
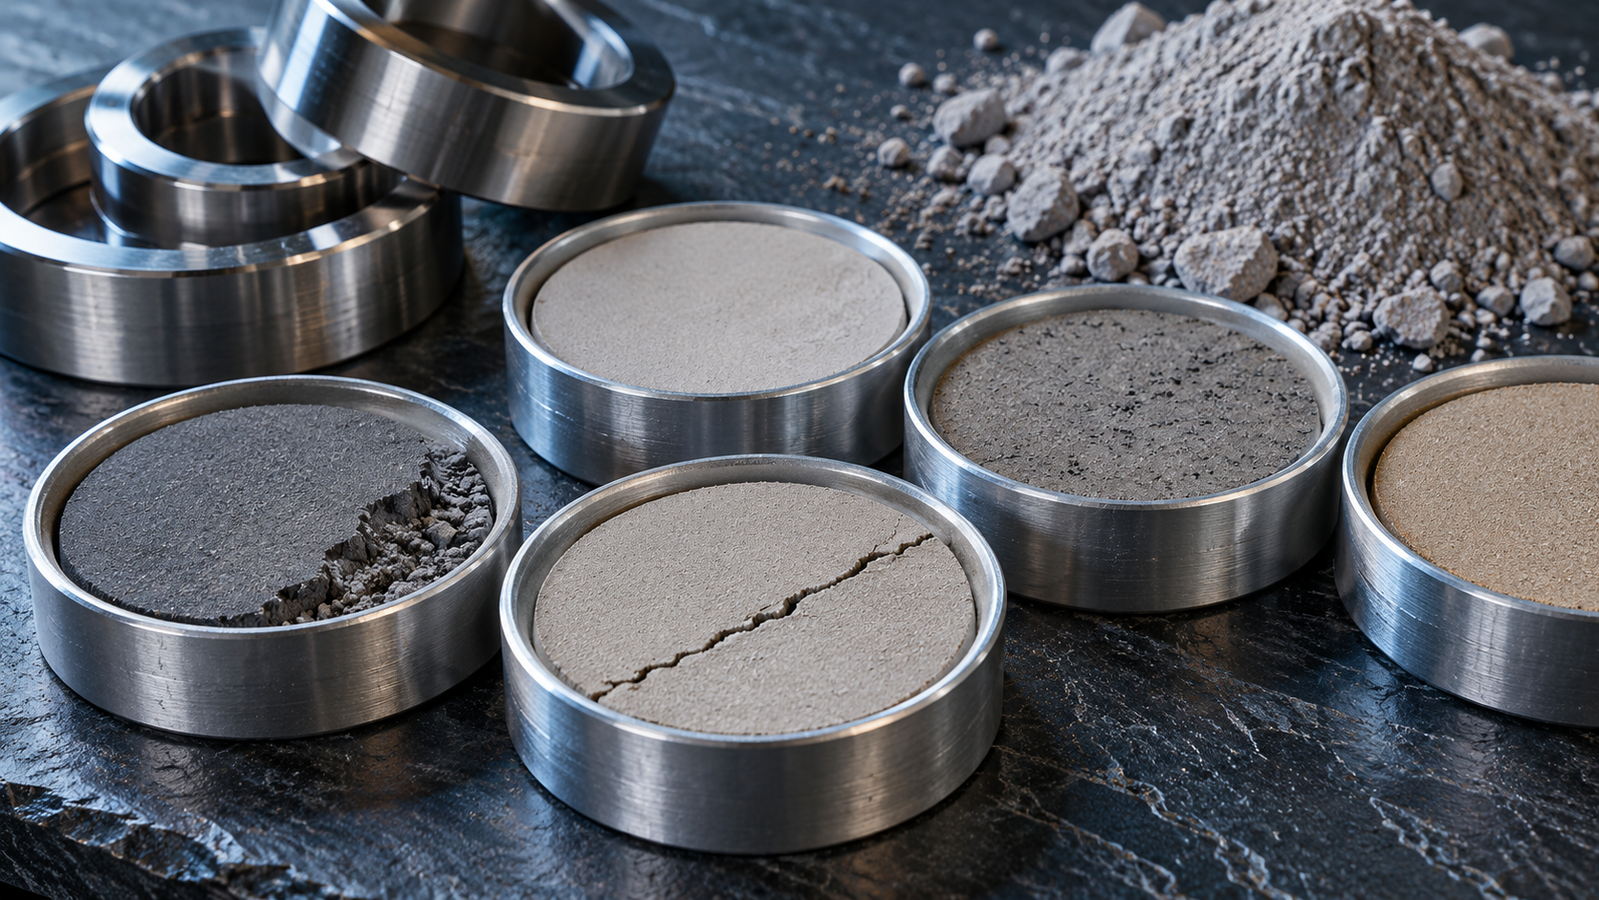
The XRF pellet guide gives the method and the press comparison covers the equipment. This page is for the day the results scatter or a pellet will not hold together. It draws on geological survey methods, studies of contamination from grinding, proficiency-test data and the statistics of duplicate analysis.
1. What a pellet has to be
A pellet is a sample in a fixed geometry. For the measurement to mean what the calibration assumes, the pellet has to be:
- Thick enough. A sample has “effectively infinite thickness” when more thickness does not significantly change the intensity of its fluorescence.1 How thick that is depends on the line and the matrix. For a soil matrix and a portable analyzer, a review gives 99 % of the signal from the first 100 µm for calcium, the first 2 mm for lead, and the first 2 cm for barium.2 For high-energy lines in light matrices, the depth can exceed what the instrument geometry allows. A known, finite thickness then has to be used.3 Quantitative analysis of samples thinner than infinite thickness has its own difficulties and possibilities.4
- Uniform at the scale of the excited volume. In portable XRF of silicate rock slabs, the mineral grains within the volume the beam excites limited the precision of the result.5
- Flat, and at the right height. The sensitivity changes with the distance between the tube and the sample, so the surface should be as flat as possible.2
- Intact and clean. Nothing should fall off the pellet, and nothing should have been added to it on the way.
2. Visible defects
- Cracks. In a study of small soil pellets, pellets pressed at low load tended to crack. At the chosen load they were intact, smooth and free of cracks.6
- Crumbling and shedding. Biological powders pressed at a conventional 220 to 440 MPa had rough, loose surfaces. Powder fell off into the spectrometer chamber, contaminated it and harmed long-term stability. Pressing at 1760 MPa gave smooth, dense pellets.7 That pressure is outside the range of PressPro™ steel dies, which are intended for use below 800 MPa; above 1200 MPa a die is seriously overloaded. The point is that a pellet which sheds powder is a fault, not a cosmetic issue.
- A rough surface. In a polymer matrix, roughened surfaces lost intensity mainly for lines of wavelength above 1 Å, that is, energies below about 12 keV. The losses grew with roughness and with wavelength. Below 1 Å the differences were small.8
- A pellet that is not flat or sits wrong. The sensitivity depends on the distance to the tube, and powder pushed into the instrument changes it.2
3. Grinding: grain size, and what the vessel adds
Grain size
Particle size changes fluorescent intensity according to how strongly the material absorbs the incoming and the emitted X-rays.9 Intensity depends on both particle size and packing.10 Across particle-size fractions of cement pressed into pellets, normalized intensities differed by up to about 17 %.11 One group summarized pellet errors from particle size and mineralogy together as about 5 %. They ground soils and stream sediments for 3 min in a planetary mill, to a mean of 4.4 to 4.6 µm. Ten pellets of each material, each ground and pressed separately, then gave relative standard deviations mostly below 2 % for major elements.12 In a tungsten carbide ring mill the grain size stopped falling much after about 90 s.13 The working rule is to grind standards and samples the same way, finely enough that further grinding no longer changes the size distribution.
What the vessel adds
The grinding vessel is part of the sample. Measured contamination:
| Vessel | What it added in the studies |
|---|---|
| Tungsten carbide | Tungsten raised by 25 to 162 ppm in four volcanic rocks, and cobalt by 0.9 to 6.8 ppm in three of them; a 68 ppm cobalt rise in the fourth was not explained by the mill. No significant niobium or tantalum, and no detectable effect on major elements.14 Cobalt in ground granite of about 15, 21.5 and 20 ppm after 60, 90 and 120 s in a ring mill, against about 4 ppm after agate grinding.13 Tungsten and cobalt in crushed chert.15 |
| Stainless steel | Iron, chromium, manganese, nickel and molybdenum in crushed chert.15 |
| Zirconia | Zirconium and hafnium.15 |
| Agate | Carry-over from earlier samples: copper fell from 415 ppm in the first sample crushed to 8.5 ppm in the last.15 |
In a study of rhenium and osmium, osmium contamination depended on grinding time, and pre-crushing the sample to a finer size reduced contamination.16 Two practical points follow from these results: choose the vessel by the elements you report, and clean it between samples. One study added that heterogeneity between subsamples was a more serious problem than contamination from the mill.13
4. Mineralogy: the error grinding cannot remove
Grinding reduces particle-size effects, but it leaves each mineral as itself. Theory predicts that the intensity from an element also depends on the composition of the grains that carry it.17 Data from 25 years of a geoanalytical proficiency test show a significant divergence between pressed-pellet and fused-disc results.18 In one laboratory’s calibration on 30 geological reference materials, pellet calibration lines were poorer than fused-disc ones. The worst correlation coefficient was 0.9595, for Al2O3, against at least 0.9981 for the discs. The authors still found pellets useful for rapid semi-quantitative work, especially for K2O, CaO, TiO2, MnO and Fe2O3.19 The abstracts of these two studies do not give the cause of the difference. When standards and samples differ in mineralogy, no pressing recipe fixes it. With pellets, the remaining option is standards of similar mineralogy, ground the same way. Fusion dissolves the minerals, within limits that the pellets versus fused beads guide sets out.
5. Pressure, binder and support
- Pressure. In a study of small soil pellets, pressure mattered less to intensity than to the pellet itself. Loads from 4 to 40 t, and holds from 15 to 180 s, gave no clear change in line intensities. Low load mainly made pellets crack. The 12 mm pellets were pressed with a polyethylene rim and base, and the paper gives the load in tonnes, not as a pressure.6 For biological powders, pressure decided whether the surface held together.7 Pressing does change the material: pressed soil pellets were much denser than the field cores they came from.20 In a transmission study, pellet pressure changed the measured attenuation parameters.21 Keep the pressure the same for standards and samples, and record it in megapascals.
- Binder. A binder holds the pellet together and dilutes the sample. In a study of ashed plant material with a wax binder, intensities fell as more binder was added. One part sample to three parts binder was judged acceptable when material was scarce, and one part to five undesirable.22 Cellulose, starch, wax and urea binders have been compared.23 The binder and its proportion have to be the same in every pellet of a calibration.
- Support. Pellets are pressed into aluminum rings,24 stainless-steel cups,20 or with a polyethylene rim and backing.12,6
6. Splitting the variance
When results scatter, the first question is where the scatter comes from. Measuring one pellet several times gives the repeatability of the measurement. Measuring several pellets from the same powder gives that plus the scatter between pellets. The difference between the two variances is the between-pellet variance, written sprep here:
Here stotal is the scatter of single readings across pellets. If the repeats on each pellet are averaged first, the variance of those means is sprep² + smeas²/n, where n is the number of repeats; the splitter below makes this correction.
The split locates the scatter; it does not name the cause. It assumes a balanced design and independent repeats under the same conditions. All the pellets come from one ground powder, so grinding is not in the estimate; a design that includes it needs pellets from separately ground portions. Measure the pellets in a mixed order, for example 1, 2, 3 and then 1, 2, 3 again, and record the order: if each pellet is measured in one block, drift of the instrument shows up as a difference between pellets. A between-pellet part that remains makes the mixing of the powder, weighing, binder and pressing the first things to test, one at a time.
The design comes from geochemistry. Duplicate analysis gives quick, realistic estimates of precision in routine work.25,26 For sampling, the basic method takes a share of samples in duplicate, analyzes each in duplicate, and splits the variance with robust analysis of variance.27 The same nested design with a duplicated preparation step isolates that step. In a food-analysis study the preparation step contributed up to 20 % of the total variability.28 An international guide covers the duplicate design for sampling and physical sample preparation.29
For XRF, one study gives an answer. A comparison of glass discs, pressed powders and counting errors on ten reference rocks found that all the methods were limited by preparation errors.30 Published pellet methods report these relative standard deviations:
- 0.1 to 1.8 % for major elements in one reference material, with ten pellets ground and pressed separately.12
- 0.3 to 3.6 % for twelve small pellets of each of two reference materials, pressed separately.6
- 0.1 to 2.6 % (n = 5), reported as the preparation reproducibility of high-pressure biological pellets. How it was calculated is not stated.7
The first two figures include both parts, and neither of those studies split them. The calculator below does, from your own data.
For the raw counts of one line, counting statistics set a floor under the measurement part. For N counted photons the relative standard deviation is 1/√N, so 10,000 counts give 1 %.31 If the scatter of repeat measurements on one pellet is close to that, only more counts will reduce the measurement part. The comparison holds for counts, not directly for a concentration calculated from several lines with background and matrix corrections.
7. Repeatability splitter
Press three or more pellets from one ground powder and measure each two or more times, the same number of times each, in a mixed order. Enter one pellet per line. The tool separates the scatter within pellets from the extra scatter between them, compares the within-pellet part with counting statistics if you give the raw counts, and checks the total against your own target.
8. Defect by defect
| What you see | Causes in the sources | What to change |
|---|---|---|
| Pellet cracks | Too low a load6 | A pressure series |
| Edge crumbles, powder sheds | Rough, loose surface of biological powders pressed at a conventional 220 to 440 MPa7 | A pressure series within the die’s limit. Clean the spectrometer if powder has fallen in |
| Light elements read low or scatter | Surface roughness, for lines above 1 Å;8 grain size, to which light elements are the most sensitive2 | Finer, uniform grinding; a smooth face |
| All lines low against the calibration | More binder than in the standards: binder dilutes the sample and lowers intensities22 | The same binder proportion in every pellet |
| Heavy elements read low | Pellet thinner than the depth the line comes from2,3 | More sample mass for the die; where that is not possible, a known thickness |
| W, Co, Fe, Cr or Zr higher than expected | Grinding vessel14,15 | Choose the vessel by the elements reported; grind a blank |
| Traces from the previous sample | Carry-over in the grinding vessel15 | Clean between samples. One study recommends agate only if it has not been used for trace-element-rich material15 |
| Pellets of one powder disagree | Between-pellet variance; in one comparison, preparation errors limited the precision30 | Split the variance (above), measuring in a mixed order; then test the mixing of the powder, mass and pressing, one at a time |
| Pellets agree, but results disagree with fused beads | A divergence between the routes is reported;18,19 mineral and particle-size effects are the reason given in one pellet method12 and in theory17 | Standards of similar mineralogy, ground the same way, or fusion |
9. A recipe that can be repeated
- Grind. Same mill, vessel, mass and time for standards and samples.
- Dry. Two of the methods above dried samples at 105 °C for 2 h,12,6 and one kept pellets in a desiccator until they were measured.12 No study read for this guide measured how pellets change after pressing.
- Weigh. Sample and binder to fixed masses, so thickness and dilution do not vary.
- Press. Same die, support, pressure in megapascals, hold and release.
- Check. A blank, a reference material and, when anything changes, a replicate set for the splitter.
10. Presses and dies
The PressPro™ XRF presses come in manual form (30 and 40 T), with a hand pump and a dual-scale pointer gauge, and in automatic form (30 and 40 T), whose screen reads force to 0.1 t. The automatic models pressurize, hold with compensation and release on a timer, and store and export their data. The dedicated automatic XRF press (30, 40 and 60 T) has a built-in Ø40 to 32 mm boric-acid die with a boric-acid sample splitter. It also has a one-key demolding function and a top plate that swings aside. XRF dies are made in four forms: boric-acid backing, steel ring, plastic ring and aluminum cup. A programmed cycle applies the same set force, hold and release to every pellet, so the timing no longer depends on the operator. It does not remove the variance that comes from grinding and weighing.
11. Related guides and equipment
- XRF Pressed Pellet Sample Preparation — the method step by step.
- XRF Pressed Pellets vs Fused Beads — when fusion is the better route.
- Manual vs Automatic XRF Pellet Presses — how finely each sets the force.
- How to Specify a Pellet-Press Cycle — pressure, hold and release as numbers.
- Pellet Cracking, Capping and Lamination — why pressed powders crack.
- Tonnage-to-MPa Calculator — force and pressure for 32 and 40 mm dies.
- How to Choose a Laboratory Hydraulic Press — the whole PressPro™ range by purpose.
- Equipment: XRF pellet presses; dedicated automatic XRF press.
12. FAQ
Why do my XRF pellets crack?
In a study of small soil pellets, pellets pressed at a low load tended to crack, and pellets at the chosen load were free of cracks. A short pressure series is the first thing to try. No study read for this guide measured how a binder changes cracking.
Does a higher pressing pressure improve XRF results?
Not necessarily. In a study of small soil pellets, loads from 4 to 40 t gave no clear change in intensities, though low loads cracked the pellets. The paper gives the load in tonnes, not as a pressure. Use a pressure that makes sound pellets, keep it the same for standards and samples, and record it.
Does a tungsten carbide mill contaminate XRF samples?
It adds tungsten and cobalt: tens to over a hundred ppm of tungsten in the studies cited. Major elements were not affected. If you report W or Co, use another vessel. Steel adds iron, chromium and nickel, and zirconia adds zirconium and hafnium.
How thick does an XRF pellet need to be?
Thicker than the depth from which the line you measure comes or, where that is not possible, of known thickness. For a soil matrix and a portable analyzer, a review gives 99 % of the signal from the first 100 µm for calcium, 2 mm for lead and 2 cm for barium. For high-energy lines in light matrices, a pellet may not reach infinite thickness in a given instrument geometry, and a known thickness has to be used.
How do I know whether the scatter comes from the instrument or the pellet?
Press three or more pellets from the same powder and measure each of them two or more times, the same number of times each, in a mixed order. The scatter of the repeats on each pellet is the measurement part. The extra variance between pellets is the between-pellet part: it shows that making or handling the pellets adds scatter, but not which step. The splitter on this page does the calculation.
Why do my pellet results disagree with fused-bead results?
A proficiency program found a significant divergence between pressed-pellet and fused-disc results. Mineral and grain-size effects remain in a pellet; the authors of one pellet method put the error they cause in conventional pellets at about 5 %. Fusion dissolves the minerals, provided the sample dissolves completely. With pellets, use standards of similar mineralogy, ground the same way.